 Overview of the Instrument Control Window
 Overview of the Instrument Control Window
To open the Instrument Control Window for each of the Q Series™ Instruments, go to the TA Instruments Explorer and double click on the instrument icon to connect to the selected instrument and automatically open the Instrument Control Window.
Many functions are available from within this main window. For detailed information, click on the underlined links in this topics. The information that is displayed may be slightly different depending on the instrument.
NOTE: If you have a Q1000, Q100, or Q10, the appearance of the tool bar and window will be slightly different. In addition, the buttons shown in the lower left pane will not be available for those instruments. The functionality is the same.


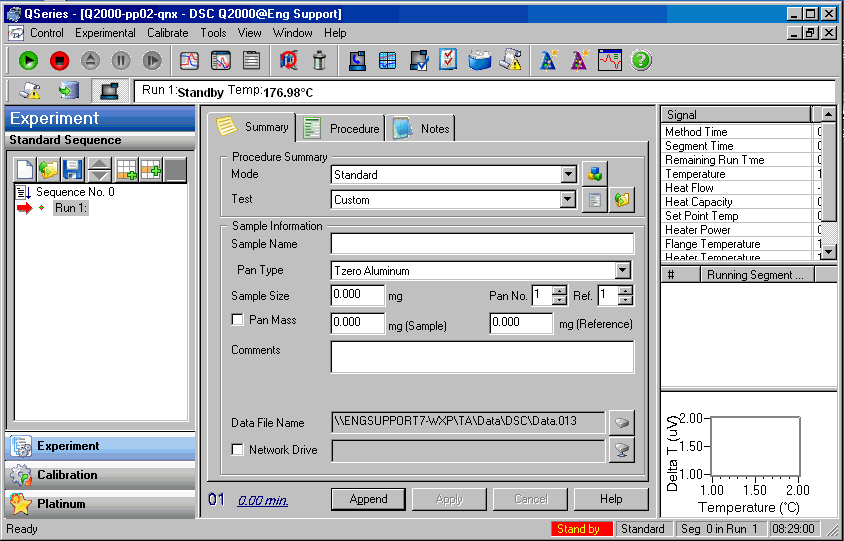
The Instrument Control Window (shown in the figure below) is divided into several main geographical regions, the menu, tool bar/status line, left pane, the middle pane and right pane.

At the top of the window is the main menu and the Tool Bar.
Below the tool bar is the Instrument Run Status Bar.
(Platinum/QNX feature only) The left
pane displays the Standard
Sequence, accessed by the Experiment
button  , the Calibration
Sequence, accessed by the Calibration
button
  , or the Platinum
features, accessed by the Platinum
button
  . The Q1000/Q100/Q10 will display only the original
standard sequence
information in the left
pane.
The main (middle) pane varies depending on whether you are in Experiment View (accessed by the Experiment or Calibration buttons) or using the Platinum features (accessed by the Platinum button).
The right pane is divided into three additional panes:
The top right pane is the Signal Display Pane.
The middle right pane displays the current Running Segment Pane.
The bottom right pane displays the RealTime Plot Pane.
At the very bottom of the window is the Status Bar, which displays the current instrument status, current selected mode, method segment and run number for the current sequence, and the instrument time.
Check View/Tool Bar to display the DSC tool bar (DSC Autosampler shown here) or uncheck it to clear the DSC tool bar from view.

Use the Tool Bar to start, stop, suspend, reject, or resume a running experiment. You can also use the tool bar to display selected windows. For an explanation of each button, see the table below.
|
Tool Bar Button |
Explanation |
|
Start |
Use Start to begin an experiment. Start executes the first step in the current run. |
|
Stop |
Use Stop to halt an experiment and save the data. Post Test functions will activate after this action. |
|
Reject |
Use Reject to halt an experiment and discard the data. |
|
Hold |
Use Hold to suspend an experiment, maintaining the current temperature conditions, until you resume or stop the method. |
|
Resume |
Use Resume to continue the method that was put on hold, continuing with the suspended segment. |
|
RealTime Plot Full Screen View |
Use this button to display the RealTime Plot window in full screen view. |
|
RealTime Plot Pane View |
Use this button to display the RealTime Plot window in the middle pane along with the Sequence Pane, Signal Display Pane, and Running Segment Pane. |
|
Experiment View |
Use this button to display the Experiment Pane along with the Sequence Pane, Signal Display Pane, Running Segment Pane, and a small (thumbnail) view of RealTime Plot. |
|
|
Use this button to reset the Autosampler. See also: Understanding the Autosampler Functions |
|
|
Use this button to start the LNCS Autofill. |
|
|
Use this button to access the Instrument Setup Wizard, which is used to synchronize the instruments and PC’s date and time, update module software, reset the instrument's parameters, and configure the instrument's network settings. See also: Using the Instrument Setup Wizard |
|
|
Use this button to open the Calibrate Analysis window |
|
|
Use this button to access the Instrument Preferences pages. These allow you to set up the Mass Flow Controller, instrument touch screen, signal display pane, and set specific DSC and Autosampler parameters. See also: Selecting the Instrument Preferences |
|
User Preferences |
Use this button to open the User Preferences window. |
|
|
Use this button to open the File Utility window. |
|
Instrument Log |
Use this button to open the Instrument Log window. |
|
DSC Experiment Wizard |
Use this button to begin the DSC Experiment Wizard. |
|
|
Use this button to perform the various calibration procedures for the DSC. See also: Calibrating the DSC |
|
Universal Analysis |
Use this button to start the Universal Analysis program. |
The Instrument Run Status Bar contains 3 views: Last Error, Data File Acceptor (DFA) Status and Current Run Status.

 Select this
icon to display the last recorded instrument error.
 Select
this icon to display the current data file information (DFA status) such
as: Transmission State, Number of Bytes Received, and Data Path Name.
 Select
this icon to display the current Instrument Run Status. This window is
user defined and can contain any or all of the following information such
as: Instrument Run State; Temperature; Data Storage State; Gas Number;
Event State; Method Segment; Weight Range; three selectable signals: Signal
1, Signal 2, and Signal 3; and color selection for the window.
To modify the information being displayed in the Instrument Run Status Bar, place the cursor inside the window and double click the right mouse button or select Tools\User Preferences\Status from the main menu to open the Edit User Preferences window. Click on the Status page, then select the items to be displayed on the instrument run status bar.
At the very bottom of the window is the Status bar, which displays the current instrument status, current selected mode, method segment and run number for the current sequence, and the instrument time.
To display or hide the status bar, check or uncheck the Status Bar command in the View menu.
The status bar shows actions of menu items as you use the arrow keys to navigate through menus. This area similarly shows messages that describe the actions of tool bar buttons as you move the cursor over them.
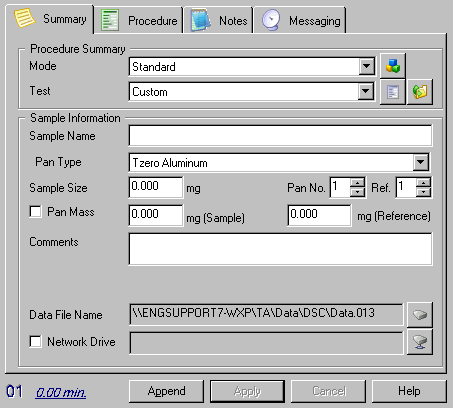
The Experiment View Pane, located in the middle of the Instrument Control window is used to define the selected test, the sample information, and the method conditions for each run. The corresponding run number is displayed in the lower left corner of this window.
Summary Page: The Summary Page contains the selected test, sample name and pan number, comments, data filename and path and any selected automated Autoanalysis. See also: Using the Summary Page.
Procedure Page: The Procedure Page contains run condition information for the selected test such as the method name and all the method segments for the selected method. See also: Specifying a Test Procedure.
Notes Page: The Notes Page contains the operator name, pan type as well as Mass Flow Control (MFC) information for the sample purge such as selected gas type and flow rates. See also: Setting Up the Notes Page.
Messaging Page: (A Platinum only feature.) The Messaging Page is used to send emails and messages directly from the instrument control program, if mail messaging is enabled. You can also attach data files directly from this page. See also: Using the Messaging Page.
