Basic strain ultrasound for clinicians.

Principles and technology for strain and strain rate imaging by echocardiography.

The page is part of the website on Strain rate imaging

by Asbjørn Støylen, dr. med.

Contact address: asbjorn.stoylen@ntnu.no


Deformation. Calving glacier in "the Gullet", antarctic peninsula.


This section updated: June 2016

The fundamental methods have been described more in depth in the sections on
The present section takes this further, into the technical aspects of how deformation is measured using the basic methods for deformation imaging and measurements.

But before that, it is important to realise that there is no gold standard for longitudinal strain. Measurement values alsays dependt on a certain set of assumptions that are chosen as definitions.

All ultrasound methods can be used to assess regional function. And, in fact, regional function is regional deformation. Basically, irrespectively of method, the fundamental indices of motion (velocity and displacement) and of deformation (strain rate and strain) are the same. Also, the display of the indices can be used across some of the methods for acquiring them. However, the application of the methods can vary, so this chapter deals with the application of the different ultrasound methods to deformation assessment, similarities and differences.


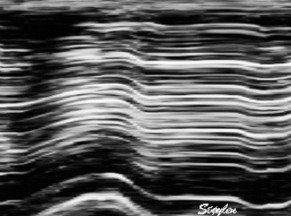
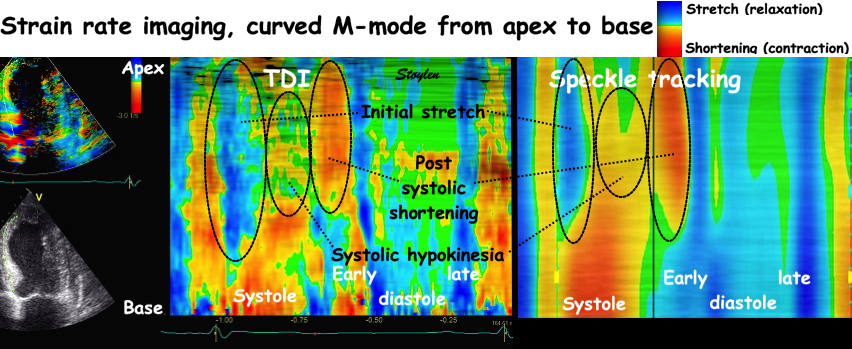
Curved M-mode from septum of a large anterior infarct, by tissue Doppler left, speckle tracking right. The two methods show the same deformation (although the ST image is much more smoothed).

And the fundamental limitations of ultrasound apply. The poorer the image quality, the less useful are any of the methods:
Garbage in - garbage out.


Thus all methods have limitations connected to the basic limitations of ultrasound, and each method have specific limitation as well, and finally there are specific limitations connected to both numerical measurement and to the deformation imaging in itself. The "limitations and pitfalls" have been moved to a separate section to enable quicker uploading.


Section Index


Back to main website index


Deformation imaging: methods and principles.

There are in principle three ultrasound methods for deformation imaging:
B-mode,
Tissue Doppler.

Speckle tracking (in B-mode images)

The physical and technical principles is treated in depth in other sections, here is a simple summary.

B-mode

The main principle of B.mode measurement is to assess wall thickening in moving images. It can be done iether semi-quantitatively in wall motion score. Wall thickening can also be measured quantitatively as transmural strain.

Tissue Doppler:

Tissue Doppler is based on the (nearly) simultaneous acquisition of colour tissue Doppler velocity values across the whole sector:


Velocity imaging. Velocities toward the probe is coded red, away from the probe is blue.  Thus the ventricle is red in systole, when all parts of the heart muscle moves toward the probe (apex) and blue in diastole, but the colours are representations of actual numerical values..

The principles of tissue Doppler is treated more in depth in the Doppler ultrasound section. The main point is that the colour displays underlying numerical velocity values, and thus the display is equivalent to a velocity field. In addition to the general problems with image quality, the main problem with tissue Doppler is the Doppler angle dependency: only the component of the velocity vector parallel to the ultrasound beams are measured, and thus the velocity field only has velocity vectors in the direction of the ultrasound beams.

Strain rate can be derived from tissue Doppler as

Speckle tracking

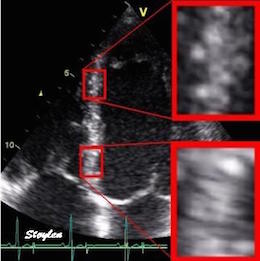
The principle of speckle tracking is discussed in depth in the basic ultrasound section. The main principle is


The two enlarged areas show completely different speckle patterns. As the speckle pattern in addition is relatively stable;
This can be used for a search for the best matching kernel in the next frame, within a specified search area.

The data from speckle tracking can be used either by placing the kernels at the segment borders, or by generating a velocity field over the whole sector. AS speckle tracking in principle is angle independent, this will result in a velocity vector field with vectors in the (more) correct directions.

However, as the depth resolution is far better than the lateral resolution, and the lateral resolution decreases with depth, this means that there is an angle dependency also of speckle tracking which increases with depth in the sector.

Thus, speckle tracking again can be used for


3D speckle tracking. 

Hypothetically, 3D speckle tracking may have some advantages over 2D:

However, the limitations of 3D ultrasound are still very severe:


In practice, the temporal and resolution is so low, as to make 3D speckle tracking inferior. And as 2D image with modern computational techniques improve in both resolution AND frame rate, 2D speckle tracking seems to increase it's edge.

In a recent study (279) of myocardial infarcts, 3D strain did not show incremental diagnostic value to the other modalities. 3D longitudinal strain was inferior to 2D longitudinal strain, and 3D Circumferential, longitudinal and area strain did not add information, as opposed to infarct area by tissue Doppler (243).


3D strain

The term 3D strain may have different meanings.
Although strain rate imaging is primarily a tool for looking at differences in regional shortening, much interst is gathered around global longitudinal strain, although that seem somewhat unnecessary, as biological variability of GLS is as high as for MAPSE (417).

However, It is important to realise that

There is no gold standard for longitudinal strain

As there is no universal algorithm for global strain, of course the concept of global strain as a universal measure of ventricular function has no exact meaning. It is only a theoretical concept.
Thjis means there is no reference standard, they are method dependent. This means that strain values cannot be validated, and different methods cannot be compared in terms of validity, and finally, normal values do only have validity within the method used.

Normalized LV shortening

Basically, Global LV strain (GLS) strain is LV shortening normalised for LV length, GLS = MAPSE / LVL (normalized displacement), and for Lagrangian strain, this the denominator is end - diastolic length (L0).


Systolic strain is normalised MAPSE. The normalised MAPSE for this ventricle with an end diastolic length of 9.8 cm and an MAPSE of 17 mm is 15 / 92  = 17.3. This corresponds to a longitudinal strain of -17.3%.


LV shortening measured by MAPSE may be subject to a systematic angle error if MAPSE is measured along the ultrasound beams as shown below:


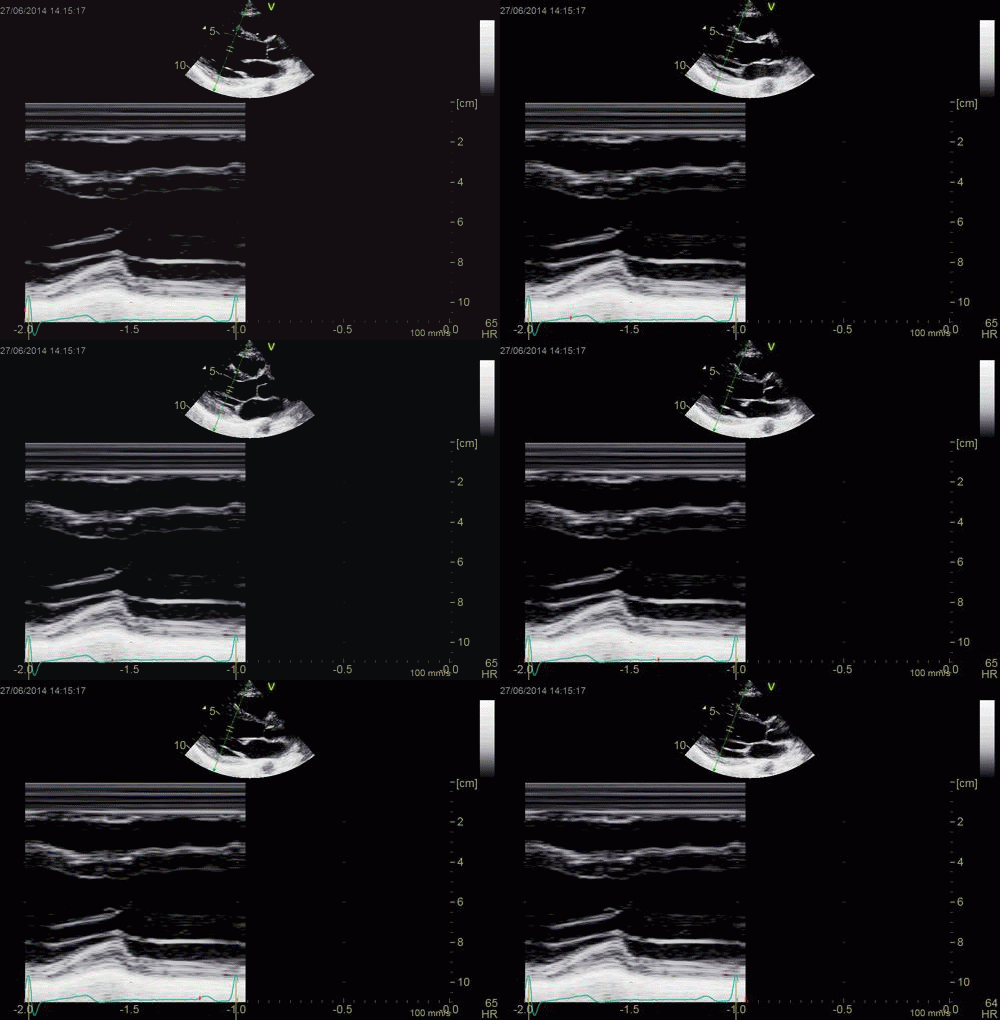
The angle error in displacement measurement demonstrated in a reconstructed M-mode. As the skewed M-mode line is shorter, scales have been lignes at 0 and 6 cm (green lines). But the caliper measures are showing how increasing angle between M-mode line and direction of motion increases the overestimation of the MAPSE. Measuring mAPSE by an M-mode along the ultrasound beam, may give an angle deviation compared to the motion of the mitral ring, but as seen this angle deviation is small.
However, this error is small.

Linear strain

But even if LV shortening measured by M-mode as MAPSE is universal and reproducible, and even reproducible across software and hardware platforms, assumptions are related to the choice of denominator, as illustrated below:


For any given MAPSE, the global strain will be determined by the choice of denominator. In this case, mean MAPSE is 1.7 cm. End diastolic length will be the denominator in the strain equation. Using the mid ventricular line (blue), gives the smallest denominator and thus the highest global strain value of 17.3% in this example. Using wall length, will result in a higher denominator, resulting in lower GLS value, the straight line approximation (green) gives an intermediate denominator and a GLS value in this example of 16.3%, while the curved lines (red) following the walls gives the highest denominator, and thus the lowest GLS value, in this example 14%.


The lowest denominator as illustrated above, is the mid chamber line (L0), giving the highest GLS value. Normalising for wall lengths instead, will give a higher denominator, and thus a lower GLS value. One approximation to wall lengths is to use the straight line from apex to the mitral points. This will give a high reproducibility by using clear anatomical landmarks, and the straigh line is reproducible. In addition, there will be little angle difference between the M-mode line and the wall line, in effect eliminating the systematic angle error. This is the linear strain method (417, 444) described here, resulting in a mean strain of 16.3 (2.4)%.

Choosing instead the curved wall line, will give a truer length, at the cost of higher variability, but the length will be systematically higher, resulting a higher denominator and lower value of GLS as shown above. In this case, there is a lagrangian strain using only the end diastolic length, as opposed to speckle tracking as shown below


Segmental strain

Measuring strain per segment will give the global strain as the mean of all segments. In the HUNT study, we measured segmental strain by the longitudinal segmental method tracking kernels at the segment borders by tissue Doppler in the longitudinal direction, and speckle tracking in the transverse direction, as described here.


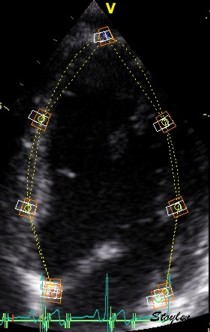
Segmental strain by tracking kernels at the segmental borders, calculating strain as relative segment length shortening, and GLS as mean of all segments.


This method was used in the first publication from the HUNT study (153). In this study, the mean GLS was 16.7 (2.4)%, so there is a fair correspondence between linear strain and this segmental method, which may be due to the fact that the segments are still treated as straight lines - another assumption.

Speckle tracking strain

Speckle tracking derived methods on the other hand, in general use curved ROI's, following the wall curvature. However, a curved line moving inwards, will shorten due to this inward motion alone. In a curved ROI following the wall, there will be little inward motion of the outer wall limit, more inward motion of the midwall line due to the thickening of the outer half of the wall, and even more inward motion of the endocardium, due to the thickening of the whole wall. This is the same effect as seen in circumferential strain (255, 456). It is also the same effect as described in the differential layer strain publications, but the idea that this is due to differential fibre function is a misconception.


Curvature dependency of strain measurement. If the ROI is curved, the midwall line will move inwards, and thus shorten, even if there is no shortening of the segment. This will result in an apparent shortening of the segment itself, adding to the real longitudinal shortening. This curvature effect is dependent on the curvature, the width and the widening of the ROI.
Effect of a curved ROI on strain. As the ventricle shortens, the wall thickens, which means the wall thickens. Systolic outer (red), midwall (yellow) and inner (blue) lines are shown in the diastolic frame to the left. In the systolic frame to the right, the same lines are shown in diastole, while the corresponding systolic lines are shown as dotted, thin lines to illustrate the motion.
There is little change of the outer ROI contour, while the midwall line moves more inward, due to thickening of the outer half of the wall. This will add to the shortening of the midwall line, due to the effect described to the left. Mean longitudinal strain will be closest to the midwall line shortening. The endocardial line will move even more inwards, by the thickening of the whole wall, and thus have even more curvature dependent shortening.

As seen by the example above, in speckle tracking derived strain, the curved ROI will result in an additional shortening due to the inward motion of the curved lines. Thus, speckle tracking strain is expected to show higher absolute values for GLS. A large meta analysis gave mean normal values of 19.7% (427), but the study was unable to show age or gender variability due to large inter study heterogeneity. The NORRE study (457) found in a single center speckle tracking study a GLS of mean 22.5 % (SD2.7). This is as expected.


However, there are additional assumptions that will differ between vendors of speckle tracking programs. Using mean strain over the ROI will result in a value close to the mid ROI line. Some vendors, however, trace the endocardial line, which will result in higher absolute values. The thickness of the ROI is often assumed to be constant, while the wall is thinner in the apex. As the apex is the most curved part, a ROI in the apex that is thicker than the wall, will result in a higher absolute GLS. The curvature in the apex may also vary, even in the same software, as shown here.

Curvature dependency of strain in 2D strain by speckle tracking. The two images are processed from the same loop, to the right, care was taken to straighten out the ROI before processing, while the left was using the default ROI. In both analyses the application accepted all segments. It can be seen that the apical strain values are far higher in the right than in the left image (27 and 21% vs 19 and 17%).  However, the curvature of the ROI even affects the global strain, as also discussed above in the basic section. 


Finally smoothing, software algorithms, such as choice of kernel sizes, selection and weighting of acoustic markers, stability of speckles, and drift compensation during heart cycle are all assumptions that are guarded as industrial secrets.

Thus, it is not surprising that there are inter vendor differences, even in speckle tracking derived strain.
Inter vendor differences in speckle tracking

As speckle tracking have been attempted to be a solution to the shortcomings of tissue Doppler, and as this can be done in ordinary B-mode. most vendors have in time come up with speckle tracking applications in their analysis software. Also, vendor independent software, using the DICOM standard, are available. 

This has been an interesting development, as the later studies have shown a fair amount of variability between strain measurements by different vendors (373 - 382). Normal values are not sufficiently harmonised that measures are interchangeable. For longitudinal 2D strain, biases of 1% absolute (373 - but here both methods had a much larger bias against MR tagging), to 5% (375).

and with correlations between measurements in same-day measures in the same patients vendor specific software as low as 0.35 (374) to 0.23 (377), but with no or less differences between different acquisitions when analysed in the same software (374), suggesting that the differences in software is the main source of variability between systems. However, even different versions of the same software has been shown to result in different measurement values (377). In general, variability have been found to be between 2 and 5% between software (378). It has been suggested that reproducibility is better than for EF measurements, but taking into account that EF by biplane tracings is the poorest reproducible parameter, this argument does not impress much.

Reproducibility within the frame of one software vendor, is much better, not surprising as discussed years ago in the paragraph above, the smoothing will always yield good repeatability (in fact, if you smooth the curves to zero, repeatability will be 100%), but still it has been found to be unacceptably high in newer studies, even within the frame of one software (377). 

Although some researchers have found a fair correspondence between global strain measurements, (376), reproducibility of regional strain is much poorer. 


Segmental strain and strain rate

Application of ultrasound methods to strain rate imaging
All regional evaluation relates to the standard myocardial segments as defined by the ASE/EACVI (146):


Standard ASE 16 segment model of the left ventricle, based on the imaging in three apical planes, resulting in six walls, and three levels, which gives 18 segments. For regional assessment, this is adequate, for calculation of global average, there being less myocardium in the apex, the number of apical segments are usually reduced to four to reduce the impact of apical measures. For longitudinal strain, only the apical planes are relevant, for wall motion score, however, assessing wall thickening, short axis views may be as important, and even better.


B-mode wall motion score

B-mode wall motion score index, is the first assessment of regional function that was used, and is still a kind of mainstay in regional function assessment. It is the visual assessment of wall thickening, and is a valid semi quantitative deformation measurement: Wall thickening - transmural strain. Du to the presumed incompressibility of the myocardium, the transmural and longitudinal strain are interrelated, and the WMS is the first regional deformation measurement, as discussed a little later. The wall thickening is graded in:
  1. Normal
  2. hypokinetic
  3. Akinetic
  4. Dyskinetic


Inferior infarct. The basal segment is dyskinetic, but there is a longitudinal motion due to tehthering
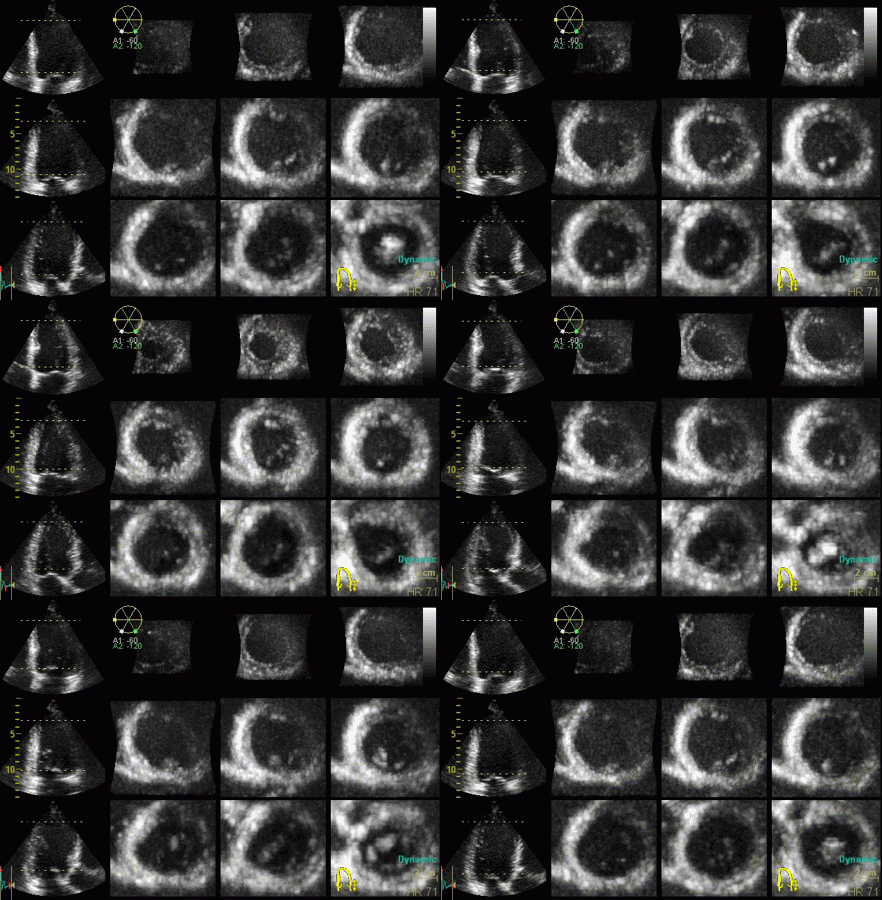
Reconstructed short axis slices from the same patient. The slices tracks the longitudinal motion, as seen to the left, but there is evident dys- to akinesia in the inferoseptum in the basal slices.


Infarct size measurement: Wall Motion Score Index - WMSI

Infarct size is related to global function. However, the measure of global function as a measure of infarct size (or the size of any regional dysfunction), is indirect.

Wall motion score index (WMSI), being the  average of wall motion score  of all evaluable segments becomes a measure of  global function, and has been shown to correlate with EF in infarcted ventricles (40). By itself, however, WMSI is a more direct measure of infarcts size. WMS is a measure of the severity of segmental dysfunction (which is related to the transmurality of infarction), and the number of affected segments is a measure of the extent of regional dysfunction. Thus WMSI is a composite of the severity and extent of the regional dysfunction, giving a more direct measure of infarct size than the pure functional measures of EF or longitudinal shortening.


However, the index is useless unless there is regional differences. Any dilated cardiomyopathy will show hypokinesia in all segments, giving a WMSI of 2, regardless of EF.

Transmural strain


Transmural strain is simply relative wall thickening. There is no such thing as "transmural myocardial function", as there are no transmural fibres. Wall thickening is solely due to incompressibility as the wall shortens, in the longitudinal, and eventually also in the circumferential direction.


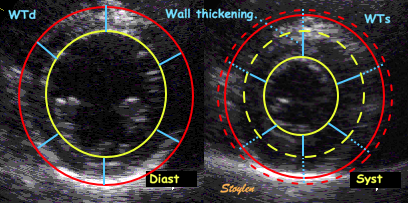
Wall thickening. Systolic wall thickening equals systolic transmural strain: WT = (WS - WD)/WD = T
Wall thickening, illustrated from the loop shown to the left. The outer (red) and endocardial (yellow) contours and wall thicknesses are shown in the diastolic image to the left, and transferred to the systolic image on the right, shown as dotted lines of the sane colour. The systolic contours are shown as solid lines. The systolic wall thickness is then (more or less) the dotted plus the solid blue lines, and the wall thickening the solid blue lines.
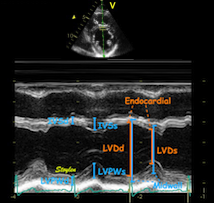
The transmural strain can be measured in M-mode from systolic and diastolic wall thickness, which will give wall thickening in only two segments, but may be taken as representative as the mean wall thickening in this plane where there is no segmental dysfunction.

Speckle tracking is not necessary for transmural strain. And even if measurement in the lateral segments is poorer, due to the reduced lateral resolution compared to the radial (along the ultrasound beam), this is the same in speckle tracking. Also, transmural strain has to be measured in short axis slices also by speckle tracking, because lateral tracking is unfeasible from the apical position due to reduced lateral resolution by depth, as shown here.

It could in principle also be measured in long axis, but this is less feasible as the basal parts of the long axis views suffer from poor lateral resolution due to the divergence of the ultrasound lines with increasing depth in the sector.


Longitudinal segmental strain and strain rate

Basically, the tracking methods will be based either on speckle tracking or colour tissue Doppler or both. The aim is to provide tethering independent segmental strain and strain rate values for assessment of local function, with subtraction of the tethering effects from neighbouring segments.


Thus, all methods may be said to be segmental strain assessment:


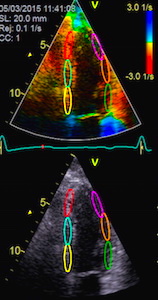
Four chamber view with tissue Doppler strain rate, where both ROI and strain length is adjusted to cover about one segment. The curves obtained by this are representative of each segment.
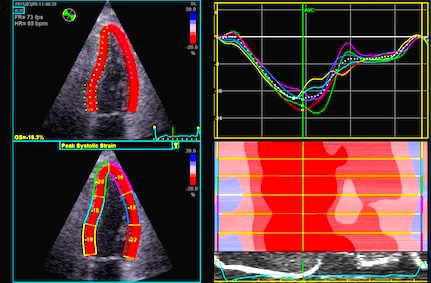
Segmental strain obtained by tracking kernels at the segmental borders, calculating the distance in each frame, deriving the Lagrangian strain for each segment. Automated segmentation by a speckle tracking method. In this application there is speckle tracking, but the results are partly smoothed along the whole ROI (all six segments) by a spline function. The segmental values then obtained are the average of the spline function for each segment.


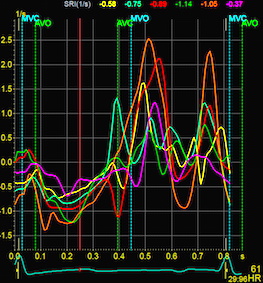
Strain rate curves from the recording above, each curve is representative of a segment.
Segmental strain rate curves from the application above, obtained by temporal derivation of the Lagrangian strain and converting to Eulerian strain rate. Strain curves abd peak systolic values from the recording above. Each curve and value are representative for the spline function in each segment. (In this image, there is little evidence for any strain gradient from base to apex!)
 
However, the segmental method, is also a description of the method assessing strain and strain rate by the tracking of the segment borders, which in fact can be done by tissue Doppler, speckle tracking or a combination of both.


Velocity gradient

The first method for measuring deformation, (apart from the wall thickening, of course), was tissue Doppler velocity gradient which is described in detail in the basic concepts section. Specifically the colour Doppler method, gave (nearly) simultaneous values across the whole sector. The frame rate was high, at the cost of low number of lines in the sector, but giving a high temporal resolution. Experiences from pulsed tissue Doppler did show this to be necessary. The simultaneity over the whole sector was the prerequisite for measuring velocity differences, i.e. velocity gradients.

The mid point of each strain length represents the pixel value of the velocity gradient or strain rate. Thus strain rate values can be mapped onto the whole sector as well.


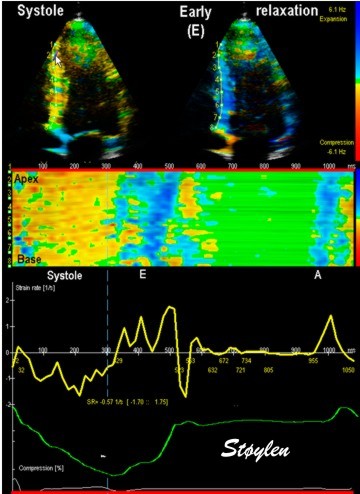
Strain rate is calculated as the velocity gradient between two spatial points, the pixel strain rate value being the mid point SR value. And thus pixel strain rate values can be mapped: Strain rate is coded yellow to orange for shortening, cyan for lengthening but green in periods of no deformation, but the colours are representations of actual numerical values.


The velocity gradients (strain rate) can be mapped onto a representation of the left ventricle (2D or 3D), and displayed as:

  • V-plot,
  • offset between the velocity curves,
  • Colour Doppler (CAMM),
  • strain and strain rate traces.

Combined strain rate image with one systolic and one diastolic frame displaued in B.mode, below, the CAMM from the septum and below that, the strain rate (yellow) and strain curves from one point in septum.

The methods for the various displays are discussed more in depth in the displays section.

V-plot


V-plot is a plot of velocities along the wall of a 2D acquisition, from the base through the apex to the opposite base, the distance along the 2D wall is the x axis. This is actually a display of the velocity values, but the slope of the plot is the velocity gradient (strain rate). It must be emphasized that the velocity values in a V-plot are simultaneous (it's the prerequisite), and thus are not peak velocities, and the slope, being strain rate, is not the peak systolic strain rate. Thus, values are lower.


V-plot of the velocities from a four chamber view. The slope of the v-plot is the strain rate.

An infarct is visible as a reduction of the slope, and the concomitant hyperkinesia in neighboring segments due to reduction in local load as an increase in the slope.


Anterior infarct, seen in the V-plot from a 2-chamber image as hypokinesia in the apical two segments, with concomitant hyperkinesia in the basal regment. There is substantial clutter noise in the inferior wall.

The V-plot, derived from autocorrelation, is vulnerable to clutter and drop outs, as decribed in the pitfalls section. this means that the V-plots are difficult to see differences between artefacts and pathology.

However, with Ultra high frame rate tissue Doppler (UFR-TDI), it is possible to process restrospective tissue Doppler from the whole field simultaneously, which means that not only will tissue Doppler be available that are relatively unaffected by clutter noise, but also that spectral V-plots can be processed, which shares the reduced vulnerability to clutter as shown in the pitfalls section.


Spectral Doppler V-plot, analoguous to the one above. With retrospective spectrral Doppler the velocities are available simultaneously over the whole field, as with colour Doppler, meaning that the spatial velocity gradients are available. The reconstructed curves with decreasing velocities from base to apex are shown top right. This means that strain rate can be visualised by the slope of the V-plot. There is substantial clutter in the lateral wall, but this is irrelevant for the slope, being related to the peak values of the spectrum.  However, as seen here, the window for the V-plot is mid systolic, and thus lower than the peak systolic, and so is the slope. being lower than peak strain rate. Image courtesy of Lars Christian Naterstad Lervik.


With V-plots infarcts are seen as a reduction in the slope of the V-plot, as in colour Doppler.

.
Spectral V-plot from two-chamber view. There is reduced strain rate in the two basal inferior segments, with hyperkinesia in the apical, and normal strain rate in the anterior wall. There is moderate clutter in the anterior wall, which is irrelevant. Again, the values are mid systolic, not peak systolic.


Strain rate and strain assessed by offset between velocity curves

Strain rate and strain can be visually assessed by the offset between the curves, when the velocity curves are obtained from points with a known (and equal) distance.


Top left: Velocity curves from four different points of the septum. The image shows the decreasing velocities from base to apex. The distances between the curves show the strain rate of each space between the measurement points (segments). Top right: the resulting strain rate curves from the segments between two and two of the velocity ROIs displayed. Bottom left: Displacement curves from the same four different points of the septum, obtained by integration of the velocity curves. The image shows decreasing displacement from base to apex. The distances between the curves show the strain of each space between the measurement points (segments). The resulting strain curves from the segments between two and two of the velocity ROIs shown to the right.


If the curves are taken from the segment borders, this is a representation of the segmental strain rate and strain. Thus, it is evident that the strain rate and strain can be visualised (qualitatively) by the spacing of the velocity and displacement curves, even without doing the derivation.

An infarct will show up as decreased distance between the velocity curves.

Top: the same velocity and strain rate curves as in the previous picture, showing even distribution of the distances between velocity curves, and equal strain rate in all segments. Bottom, a patient with a small infarct in the apical segment, where the distance between the two apical velocity curves is lo, and so is the strain rate curve from the segment beweeen them.

Colour M-mode

The velocity gradients van be mapped onto the representation of a wall. This is a semi quantitative plot of the values, but it will give quantitative timing information.

The parametric display of curved M-mode is most useful in strain rate, showing the quick shifts in negative and positive strain rate. It enables:
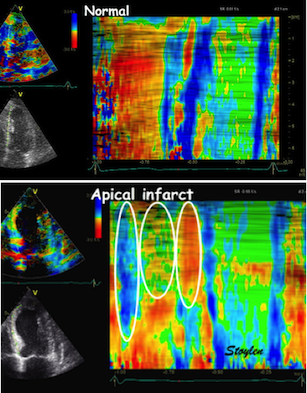


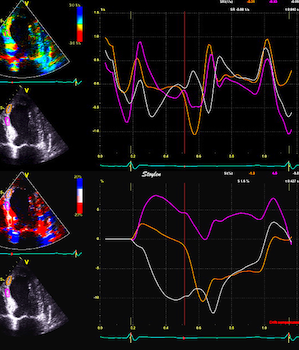
Colour M-mode can show the presence of disturbed regional function (as here by the initial stretch, reduced contraction and post systolic shortening in the apical segment in the infarct in the bottom panel). It can even show changes with better spatial resolution, showing sub segmental extent of changes.
Colour M-mode can be used semi-quantitatively for wall motion score, although this is longitudinal strain, not wall thickening, this has been shown to be equivalent (6, 7). Curved M-mode can also be used quantitatively for timing information. The timing differences between different parts of the myocardium, is important additional information, and can be seen to be fairly robust despite the presence of heavy clutter noise in this image.


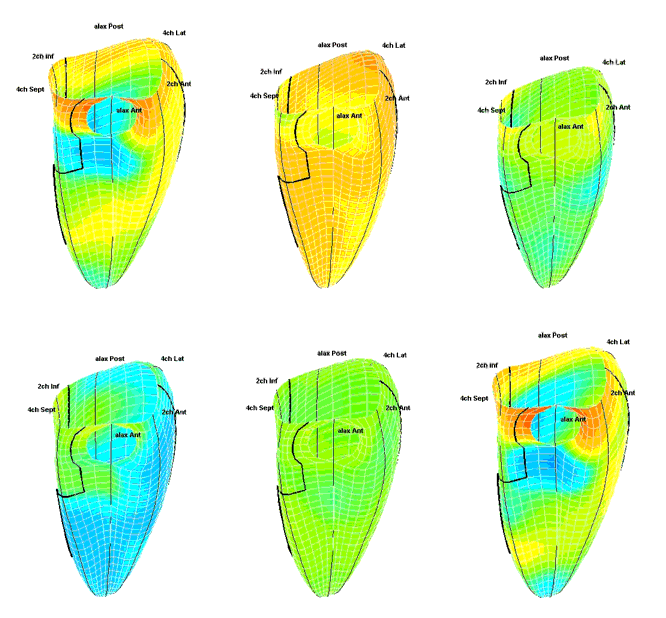
3D surface mapping of tissue Doppler data

The colur display of velocity gradient can also be used for mapping on a surface representation of the left ventricle obtained by reconstruction from 2D planes or from a 3D acquisition. The fundamentals of this method has been explained elsewhere.


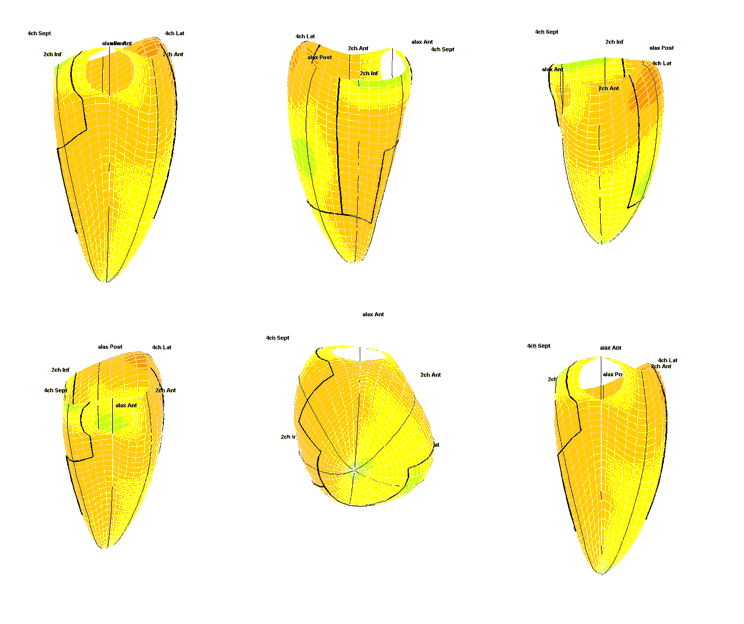
Strain rate 3D mapping in time. The problem with the moving loop is the same as in 2D display. During ejection there is a short period with homogenous colour, when all the ventricle shortens simultaneopusly. But during diastole, there is a continuously shofting array of colours, as different parts of the ventricle elongates at different times.  the continuously shifting colours are not easy to interpret. In addition it won't show all of the surface simultaneously.  (Image courtesy of E. Sagberg.) Strain rate 3D mapping in space. Stopping the frame in one point in systole shows a fairly even distribution of colur (yellow - shortening), meaning an image with normal systolic function and fairly free from artefacts. In order to see all of the surface, however, the image has to be rotated.(Image courtesy of E. Sagberg.)


3D reconstruction into bull's eye and 3D surface is not only for display, it enables another quantitative measurement:
   

Infarct size measurement by area

Due to the correct area representation of the LV surface (22), combined with the representation of the strain rate values on that surface, the area with values below a cut off limit can be delineated, and the area can be measured as a percentage of the total LV area:


The infarct is shown as the akinetic area in the apex (green). True area fraction measurement depends on the ture curvature representation of the LV surface. (Image courtesy of S Malm.)

Basically, this needs heavy editing out of artefacts, using the evaluation from B-mode. The fundamental limitations of tissue Doppler apply, meaning that clutter and other artefacts need to be recognised and edited out before thresholding and area measurement can be done with reasonable precision.
Editing is best done in bull's eye view, where all of the surface is visible, but for area measurement, this editing needs to be transferred back to the surface dataset. This was presented and shown to correlate faily with the WMS in an infarct population (242).


The principle of infarct size measurement by strain rate. A 3/4D dataset is reconstructed from the three standard apical planes as described here.  top left the data are displayed as a set of colour M-modes from the six walls, the two black arrows shows the infarct area, while the green arrow shows a basal artefact. The bull's eye reconstruction at the bottom left shows the combined data in mid systole, with interpolation between the planes. The infarct area is shown with dyskinesia, in cyan. However, there is also a reverberation artefact, evident with the abrupt shift from deep blue to deep red colour. (In bull's eye, reverberation artefacts are always semi-circular.) This is marked with the blue arrows. The apex is blanked with dark blue, and is automatically excluded. Thus, simple value thresholding will not define the area with sufficient precision. AS deformation images are always done in post processing, the information is always added to the B-mode information we get from visual assessment, and the precision can be increased by including the B-mode wall motion analysis (top right). Thus, the thresholding is given better precision by eliminating artificial values. In this case, the limit for akinesia was set to absolute value of strain rate < 0.25 s-1, and for hypokinesia from 0.25
-1 to 0.5-1.  The hypokinetic area is then weighted by 0.5. corresponding to non transmurality. Finally, the area on the bull's eye is converted to true real area by taking the surface curvature into account as seen to the right. Thus, the akinetic area being 7% of total area, and hypokinetic area being 10% of total area, but with a weight of 0.5, the total infarct size is 12% . (Original image courtesy of  A Thorstensen)


But using this, it is even possible to measure the areas of hypokinesia and akinesia separately, by applying appropriate cut offs. Thus the hypokinetic area may be weighted by 0.5 compared with the area of akinesia. This would be related to non- transmural vs transmural infarcts, and by this method it would be even better correlated with total infarct size (243).


This method has shown good correlation with infarct size by MR, and incremental precision compared to WMS alone (243).

Numerical strain and strain rate traces

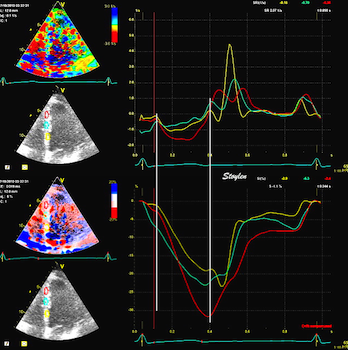
Strain rate has better temporal resolution than strain. Strain rate shows changes in the deformation status of a segment in each time point, while strain in any time point is the cumulated strain rate up to that frame, compared to the start. Thus peak values of the rate of change in deformation can only be measured by strain. This means also that strain is only used as a systolic measure, strain rate gives information also about diastole.


Normal subject. Strain rate (top) shows the changes in deformation, while strain (bottom) shows the deformation statur at any given point in time. Thus, quick changes will only show up in strain curves as changes in the direction of the curves. This is especially evident when looking at the diastole.
In this case with a large antero apical infarct, changes in segmental deformation from stretch to shortening during ejection is evident with strain rate (top), but not in the strain curves (bottom). Peak rate of change  in any phase can be measured by strain rate, not by strain.   Changes in strain (i.e. strain rate) can be puzzled out qualitatively, if one looks at the changes in direction of the curves (which in fact is strain rate). The main impression from strain, however, is the systolic stretch in the two apical segments.

The segmental strain and strain rate method

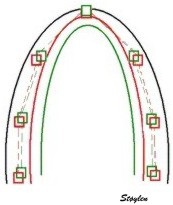
Segmental strain and strain rate is taken to mean the deformation measured over a complete segment, giving the average value for the segment. The segmental strain method tracks the motion of a kernel or ROI at the segmental borders, and calculates the strain rate from the velocity differences, or strain from motion differences directly.


Kernel displacement.  Following the kernel through a whole heart cycle, will lead to a displacement curve shown to the right. Temporal derivation (displacement per time, or frame by frame displacement divided by the time between frames) results in the derived velocity curve shown below. From two different kernels, the relative displacement and hence, strain as well as strain rate can be derived. The strain obtained by simply subtracting the two displacements and dividing by the end diastolic distance is the Lagrangian strain. To obtain the Eulerian strain rate, the correction has to be applied for each frame.

If Kernels are placed at the segmental borders, the result will be segmental strain and strain rate in six segments per plane. Placing the kernels in mid myocardium in a short axis view, it can also be used for trackinglobal and regional  circumferential strain and rotation in the imaged plane.


Tracking of segmental borders. The strain is the relative change in segment length, and the strain rate the strain change per time. Segmental strain in six segment in four chamber view.  Schematically , the motion of the segmental borders is shown by the arrows, decreasing from base to apex. The segmental strain is the difference between the motion of the two ends of a segment. The curves are from a real example. The blue strain curves show segmental values, while the green curves are the average of the wall for comparison.Image courtesy of H Dahlen.

Segmental strain has several advantages:
  1. As measurements are fairly noisy, the average of a whole segment will tend to be more robust. This will give a high signal-to-noise ratio as discussed above. The segmental strain is equivalent to a strain length equal to the segment length, i.e. about 3 cm. The segments are the basic unit for evaluating regional wall motion score (WMS) in the recommendations of the ASE/EAE (146), and so far the clinical usefulness of a higher resolution has not been demonstrated.
  2. Tissue Doppler measures the velocity gradient along the ultrasound beam, not along the segment. Increasing the strain length will reduce noise, but the strain length will follow the direction of the ultrasound beam, and this will give problems where the alignment is not perfect. Tracking the end of each segment, ensures a better measurement of the segmental longitudinal shortening.This will make the method less angle sensitive, as well as more similar to the other methods as the measurements are related to kernels at the segmental borders.
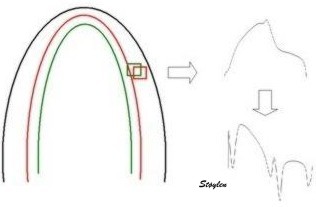
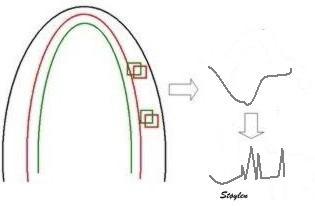
  3. As long as segmental length is followed by tracking the ends of the segment, the value will be little affected by smaller artefacts within the segment as illustrated below.
The disadvantages may be that
  1. The method will be measuring only two points along the line and thus
    1. be less robust than the full segmental average (provided the data in the segment are good).
    2. be extremely sensitive to artifacts at the points of tracking as seen below.
  2. The low resolution in the radial (longitudinal) direction. Sub segmental values cannot be extracted (although they could be interpolated).
  3. If the tracking at one segmental border is poor, it will affect two segments on both sides of the border , although it may be avoided by adjustment of the kernel position as discussed in the pitfalls section.


The segmental method results mainly in numerical traces for  measurement of peak values. Colour M-mode is possible in principle, but to achieve the gradual display, interpolation between mean values have to be applied. This would result in a spline smoothing similar to that of 2D strain, although limited to two segments at a time. So far this is only a theoretical possibility.

Segmental strain by tissue Doppler

Instead of calculating strain rate along one ultrasound beam, it has been proposed (44) to calculate strain rate from the velocity differences at the segmental interfaces and segment length along the wall. (Any points will do actually), as shown below. This ensures that tracking is done at the real segmental borders, and makes the method less dependent on the alignment of the ultrasound beam and the myocardial wall. The method is still angle dependent, but this is the ordinary angle dependency of Doppler, not the angle dependency of strain and strain rate. The method has not been implemented in clinical use.

Segmental strain rate, measured by tissue Doppler, but by segmental velocities that do not lie on one ultrasound beam, while strain length is measured along the wall, between the velocity points. 

Tracking is possible, by calculating the displacement from one frame to the next, along each ultrasound line, and thus, the segment length.This method, with kernels placed as shown, will result in measurement of segmental strain and strain rate, segment length being defined as a straight line. This means that there will be less angle dependency than in segmental strain rate by tissue Doppler, and thus the tracking may be better than the velocity gradient method for segmental strain.

This was a theoretical approach in the time when only tissue Doppler was available for tracking.

The advantages of segmental strain are present also when using kernel tracking with kernels at the segment borders using either speckle tracking or combined tissue Doppler and speckle tracking. Both those methods are in addition angle independent, as the segment orientation follows the myocardium, and the strain is simply calculated along the length of the segment as it is.

Segmental strain by speckle tracking

This method, with kernels placed as shown, will result in measurement of segmental strain and strain rate, segment length being defined as a straight line. This means that there will be less angle dependency than in segmental strain rate by tissue Doppler, and thus the tracking may be better than the velocity gradient method for segmental strain.

The advantage is the same as in segmental strain generally, being little angle dependent, robust against noise and little affected by sub segmental artifacts. And kernels may be replaced to avoid areas of reverberations or drop outs, if possible.


The advantage of this method is that it tracks in two dimensions, along the direction of the wall, not along the ultrasound beam, and thus is considered angle independent.  


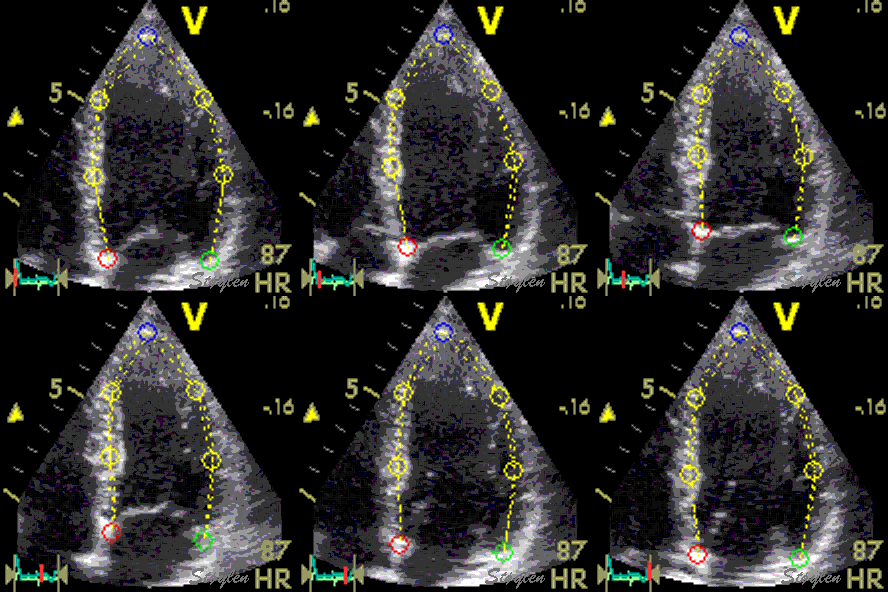
Longitudinal speckle tracking, with kernels at the segmental borders in four chamber view.

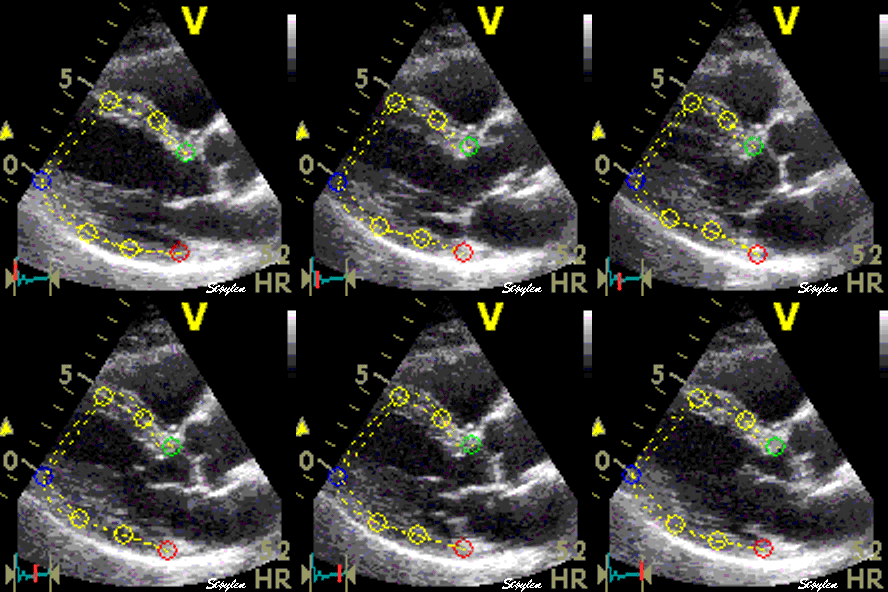
Longitudinal speckle tracking, but done crosswise in parasternal long axix view.

In principle, pure speckle tracking  is direction independent, and can track crosswise. This means true longitudinal strain, as the length will follow the "tilting" of the segment as well as the shortening as seen from the example above. In addition, the B-mode has a far better lateral resolution than tissue Doppler.


Thus, as the lateral resolution is far less than the axial, the two directions are not equal. This means that tracking in the longitudinal direction is better than the lateral, so the method is angle dependent to some degree. And increasing the frame rate (for instance to compensate for high heart rate) reduces the lateral resolution even more, reducing the angle independence of the speckle tracking method even further.


Segmental strain by combined use of tissue Doppler and Speckle tracking.

Modern ultrasound equipment has the capability of acquiring second harmonic grey scale images with an acceptable frame rate of 40 - 50 FPS and good lateral resolution, simultaneously with tissue Doppler data. This opens the possibility of tracking along the ultrasound beam by tissue Doppler,  while tracking transverse to the ultrasound beam by speckle tracking (124) in the grey scale data. The fundamental advantages as well as limitations of segmental strain remains.


Combined search by tissue Doppler and speckle tracking. The kernels are shown as the small, round, yellow circles.  The longitudinal search area along the ultrasound beam by tissue Doppler is shown in red. The lateral search area by speckle tracking is shown in white. The result is tracking of segmental borders. The strain is the relative change in segment length, and the strain rate the strain change per time.
Display of segmental strain rate from the six segments.

In addition, the combined method has additional advantages:
  1. As longitudinal strain is the main issue so far, the advantage specifically of the combined method is that longitudinal tracking is done with the high frame rate of tissue Doppler. This may give an additional benefit, at least in strain rate.
  2. Doing only transverse search by speckle tracking simplifies the search algorithm, limiting the search area to a sector extending in the radial direction and thus reducing the time for the speckle search.
  3. The transverse tracking by speckle tracking eliminates the problems of both insonation angle and low lateral resolution of tissue Doppler alone. Thus, the method is just as angle independent as speckle tracking, as opposed to the segmental strain by tissue Doppler alone.
  4. If the tracking of tissue (lateral tracking) is poor, the measurements will be similar to the segmental strain by tissue Doppler, meaning that it will be somewhet angle dependent, but still less than the velocity grasdient method.
  5. Finally, it utilises the full dataset inherent in the combined image.
The combined method can be used in different ways to analyse strain rate imaging (127):
  1. Segmental strain by speckle tracking alone
  2. Segmental strain by Combined tissue Doppler and speckle tracking
  3. Strain rate by longitudinal velocity gradient, by placing an ROI and strain length in mid segment (in end diastole)
    1. Letting the ROI remain stationary or
    2. Letting the ROI follow the segment being tracked by the combined method
3b is similar to ordinary strain rate by tissue Doppler, 3a is improved, as the present applications only offer the manual tracking as a possibility, while the combined method gives the strain rate. The tracking has been shown to be advantageous in the apical segments, in a comparative study.

This method  has already been shown clinically useful in stress echo (128), giving a sensitivity of peak systolic strain rate for ischemia of 84% and an AUC of 0.9, compared to coronary angiography, and with a feasibility at peak stress of 80% of segments. It is also the method used for the HUNT study (153), for automated analysis. In this study methods 2, 3a and 3b was compared as well, and compared to 2D strain, comparisons shown below, showing little differences between mean values and normal variations.


2D Strain by speckle tracking.

The application known as 2D strain or AFI (automated functional imaging) by GE Vingmed, is generally seen as a speckle tracking method, which actually is  the basic  method. Tracking is done by the same method, (sum of absolute differences). However, the method also has implemented:


Visualisation of the tracking. Observe how the bullets in the midline follows the myocardial motion. However, due to the smoothing function of the application, this may be virtual tracking, being extrapolated from AV-plane motion, thus the true tracking of the local tissue may be difficult to assess.
With a greater number of kernels, distributed both along and across the wall, each kernel can be tracked individually, and displacement and velocity can be measured in two dimensions, both longitudinally and transversally for each (73).


 From this, differential motion - i.e. deformation - can in principle be measured, both in the longitudinal and transverse direction. The smaller the kernel, the less certain will the tracking be, but this can be compensated by selection of kernels on the basis of a stable pattern from one frame to next.  One method of insuring stable tracking is to discard kernels that are not present in a sufficient number of frames. In the same way, kernels that does not move can be discarded, reducing the influence of reverberations.However, the dependence on recognising stable kernels from one frame to next, makes the method even more frame rate sensitive.

2-dimensional strain by speckle tracking.  Each red point represents a kernel for speckle tracking. Velocity and displacement decreases from base to apex, and the differential motion along the segment gives longitudinal strain and strain rate. As the true direction of the motion is tracked in this instance, the transverse component can also be tracked, and the differential motion from kepi- to endocardium can also be tracked., giving transmural strain and strain rate.

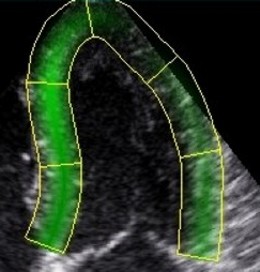
2D strain in practice. The midwall line is used for the longitudinal strain, being an average of all points in the wall. The ROI follows the wall, the limits can be seen diverging in systole, converging i n diastole, giving the transmural strain and strain rate at the same time. The colours show longitudinal strain rate, green is shortening and red is lengthening.

In order to make the speckle tracking more robust, values are averaged over a whole segment.

However, this is one of the main limitations of the data in the bottom: The smaller the kernels, the greater the uncertainty of position, and the more noise. Thus, a liberal amount of smoothing has to be done. Averaging a large number of kernels may make tracking more robust, although this reduces the number of useful speckles in each kernel. This can be done in various ways and combinations. With more than one layer of kernels across the wall, the longitudinal measurements can be averaged from all layers, giving a transmural average. Longitudinal averaging can be done along one segment, giving the segmental average. This can also be done in a more sophisticated way, by spatial interpolation along the wall. This will result in a gradual effect of spatial smoothing, although the extent of the smoothing is less easily discerned. Thus, the tracking of a region of the ROI, is not speckle tracking alone, but also extrapolation of the AV-plane motion i.e. virtual tracking. This is discussed below.


The method starts with generating a velocity field across the sector (velocity being the displacement between one frame and the next, / 1/FR), more or less as in tissue Doppler, but the velocity vectors being angle independent. Thus the displacement ad strain rate and strain can be derived in the same way.

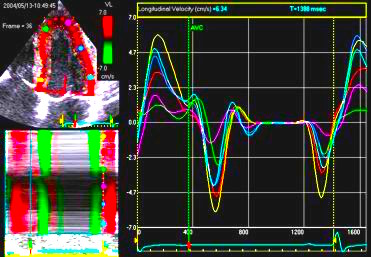
Longitudinal velocity
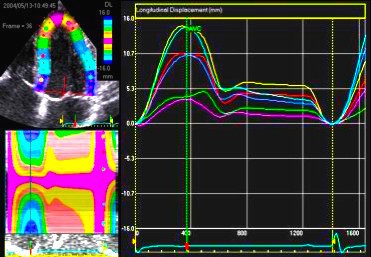
Longitudinal displacement
Longitudinal strain rate
Longitudinal strain

The method looks much less noisy that tissue Doppler derived curves, but as the basic data is a velocity field, this is due to differences in smoothing.

However, it's an illusion that there is less noise in speckle tracking than in tissue Doppler. This illusion is created by the extensive smoothing used in speckle tracking applications.

As explained above, the speckle tracking starts with generating a velocity field, by measuring the speckle displacement and dividing by the inverse of the frame rate (the sampling interval). This velocity field is then used for calculating the strain rate (by spatial derivation) and strain (by temporal integration) as described above.


We did an initial evaluation of an earlier version of this application in February 2004, comparing the longitudinal motion and deformation measurements by this application with those obtained by tissue Doppler, in separate images. The study consisted o0f 20 patients with a wide range of function.


Strain rate and strain, comparison of 2D strain and Tissue Doppler. There is a considerable spread between methods, but most probable due to variability of especially of tissue Doppler. There 2D strain gives lower values than DTI, and this tendency increases with increasing strain rate/strain. The term "CEB" meaning "computerized eye balling" was an early term to describe the application.

When measurements was sorted in quartiles, Concordance was only between 27 and 34%. Feasibility was the same with 2D strain and TVI. Further investigation was not undertaken at that time, as the application was modified in later versions. Other authors have found a much better correspondence between TDI and 2D strain (73), with correlations of 0.94 and 0.96 for strain rate and strain, respectively. However, as seen by the curves in the figure below, both data sets are analysed by the 2Dstrain software, and thus subject to the same high degree of smoothing, so the results do not reflect independent analysis.


From a validation study where tissue Doppler and 2D strain derived strain rate (left) and strain (right) values were compared. However, as can be seen
from these curves, both curves are very smoothed and concordant. Thus, much of the concordance must be assumed to be due to smoothing, as both
methods were processed by the 2D strain software, and not by independent analysis software. Adapted from Modesto 2006 (73).


The high correlations found in this study was due to the fact that noise was smoothed out by the analysis software. And also: If this study had been true, there would not be any use for the 2D strain method to reduce noise, the tissue Doppler was as good.

This is illustrated below:

The lines looking smoother, is a function of the averaging function used in the algorithm, the application will do the same to tissue Doppler data.


Strain rate curves from speckle tracking and tissue Doppler from the same cine - loop.  The same smoothing is applied to both, showing that smoothing of the curves is not the result of the robustness of the algorithm, but of specific temporal and spatial smoothing applied by the application. The curves differ somewhat (but not too much), as strain rate is calculated with different angle and lateral resolution.


Another study by Cho et al (148) finds only correlations of longitudinal strain by 2DS and TVI with MR tagging of 0.51 and 0.40, respectively. This may reflect the real precision of both methods (and of MR tagging as well?) but then the correlation between the methods cannot be higher, and the higher correlation in the previous study must be due to smoothing.

Transmural and circumferential strain.


Wall thickening. Systolic wall thickening equals systolic transmural strain: WT = (WS - WD)/WD = T
Wall thickening, illustrated from the loop shown to the left. The outer (red) and endocardial (yellow) contours and wall thicknesses are shown in the diastolic image to the left, and transferred to the systolic image on the right, shown as dotted lines of the sane colour. The systolic contours are shown as solid lines. The systolic wall thickness is then (more or less) the dotted plus the solid blue lines, and the wall thickening the solid blue lines.
The transmural strain can be measured in M-mode from systolic and diastolic wall thickness, which will give wall thickening in only two segments, but may be taken as representative as the mean wall thickening in this plane where there is no segmental dysfunction.

Speckle tracking is not necessary for transmural strain. And even if measurement in the lateral segments is poorer, due to the reduced lateral resolution compared to the radial (along the ultrasound beam), this is the same in speckle tracking. Also, transmural strain has to be measured in short axis slices also by speckle tracking, because lateral tracking is unfeasible from the apical position due to reduced lateral resolution by depth, as shown here.

It could in principle also be measured in long axis, but this is less feasible as the basal parts of the long axis views suffer from poor lateral resolution due to the divergence of the ultrasound lines with increasing depth in the sector.
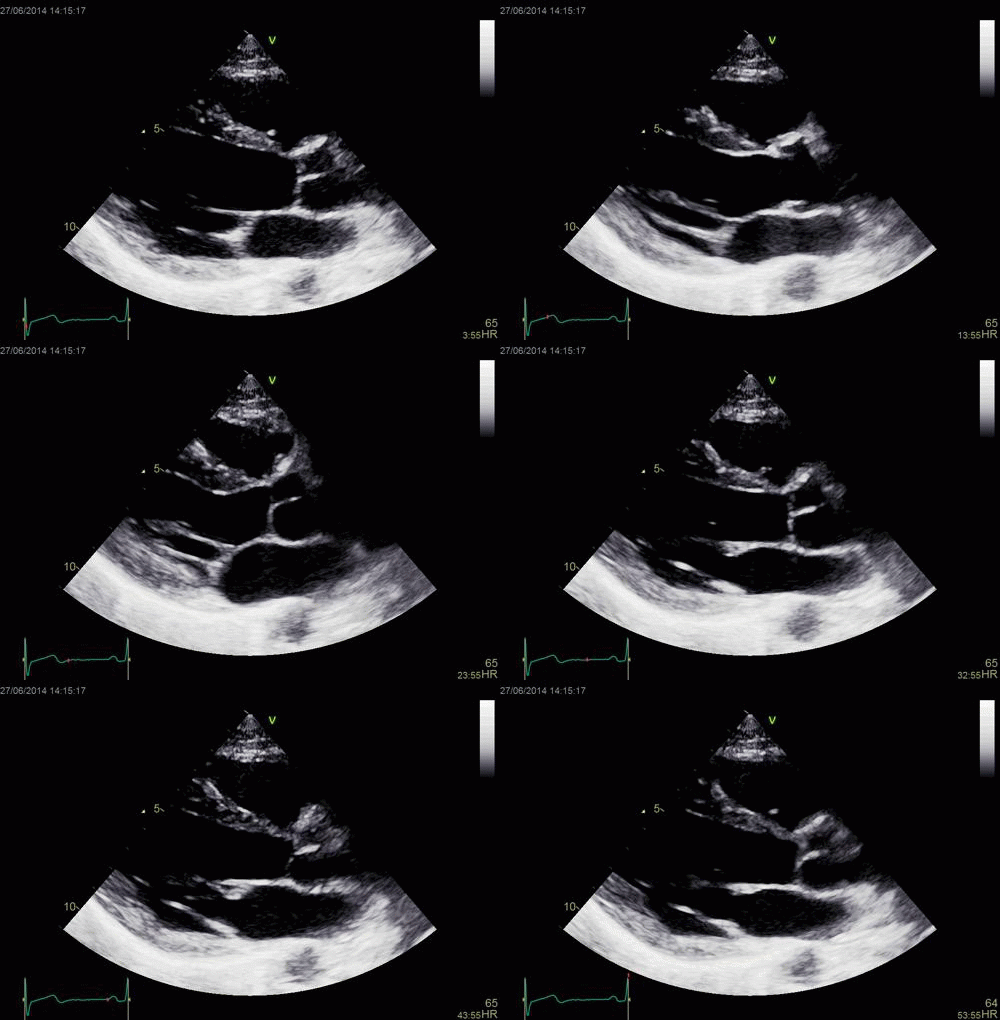

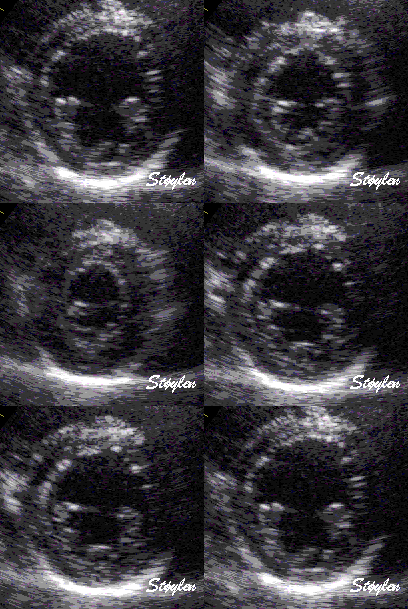
As speckle tracking is partially angle independent, it may be applied to the short axis as well. The main concern about tracking in short axis views, however, is the long axis motion. This means that there is between 1 and 1.5 cm out of plane motion of the base, and about half that in the midwall.


Normal long axis image. The motion of the base of the ventricle towards the apex is evident in the long axis view.
Lopoking at the short axis view from the base, this is not evident, but comparing with the image on the left, this mus mean that during systole, an entirely new part of the ventricle moves into the imaging plane.

This, of course affects M-mode measurements as well:


As can be seen, the base of the heart moves through the M-mode line during the heart cycle.
This means that measurements in fact are taken from different part of the ventricle in end diastolie and end systole. It seems to indicate that systolic measurements are done in a part of the ventricle with narrower lumen and thicker wall, thus may over estimating  both fractional shortening and wall thickening.


That means that the tissue present in end diastole is not the same as in end systole. This also means that the speckles that are tracked do not represent physical myocardial points. Thus, the meaning of transmural and circumferential strain becomes slightly dubious. However, this do not only pertain to 2D strain. As shown above, this is the same problem even in parasternal M-mode. (Which, despite this, has worked well for 50 years). However, this remains a caveat when new measures are added. In the question of rotation, especially torison, the spiral course of the longitudional fibres may even cause the displacement to cause the fibres to be traced as rotating around the cavity centre.


The speckles may be the endocardial borders, or even the fibres that may run in spiral. Thus, in the base, the physiological meaning of the obtained values is questionable.


Accepting the validity of speckle tracking in short axis views, it then allows tracing of transmural and circumferential strain. Transmural strain is wall thickening, and the tracking in the transmural direction will be dependent on the resolution, which is better along the ultrasound beam than laterally. The physiological meaning of circumferential strain, shouold be midwall circumferential shortening, which actually is nothing more than * midwall fractional shortening as reasoned above


2D strain applied to short axis image. Again this can be seen to track in two dimensions, the thickness following the wall thickening, and the mid line in the ROI Showing midwall circumferential shortening.
Transmural strain. In this image the application only measures between 10 and 15% transmural strain, while the true values in a normal person as this may be as high as 40 - 50%. This is probaly due mainly to a too thick ROI (default), although poor lateral tracking combined with smoothing may contribute.
Circumferential strain from the same processing.   In this image about 15%, which is closer to normal. This, however, does not mean that the circumferential strain is more reliable, it means that the thickness error in the ROI is compensated by an underestimation of the cavity volume. It's equivalent to the fractional shortening increasing in hypertrophy, despite reduced wall thickening. (Actally circumferential strain = * midwall FS. )


Repeatability of 2D strain.

Basically, the 2D strain application, due to a high amount of smoothing, should have a high repeatability, as shown here. However, this will only be the case as long as the tracing is done in the same manner each time, in the same loops. This means a very standardised endocardial tracing, and a standardised ROI width. As shown above, the values are extrmely dependent on the ROI, both curvature and width of the ROI. Utilising the automated features of the application will ensure this, but will not necessarily ensure the correct shape and  width of the ROI, and hence, not necessarily the correct values either. In a study (208) where repeated measurements in the same loops was compared for different centres, the 95% limits of agreement were -11.4% to +11.8%, but with very little bias. Repeated recordings within one hour (presumably by the same observer), had limits of agreement of -9.6 to + 9.7%.


Both segmental strain and 2D strain have been compared for longitudinal strain, and compared to tissue Doppler (151, 153) as shown in this table. Both seem to agree fairly well. In addition variability of strain rate (but not strain) is lower by both methods than by tissue Doppler. However, both Segmental strain and 2D strain use automatic segmentation, this may be some of the reason for better repeatability, not speckle tracking vs. tissue Doppler per se. However, the higher variability of strain rate by velocity gradient, shows this method to have a somewhat higher noise componenet. Feasibility of both methods is reported to be between 70 and 80% of segments (lower in the HUNT study,but this is due to the aim of the study, to provide normal values as free as possible from artefacts.


Summary of differences and limitations of segmental speckle tracking and 2D strain.

It is important to be aware of the limitations of each method. It should also be emphasized that different methods are not necessarily directly comparable, and may yield different normal values and cut offs, due to the different ways parameters are measured. One of the fundamental differences stem from the different geometrical assumptions that are present as shown below:


Differences in geometry between methods. The fairly invariable outer LV contour is shown in heavy black. The diastolic inner contour, segmental borders, kernel positions and measurement lines are shown in light black. Systolic inner contour,
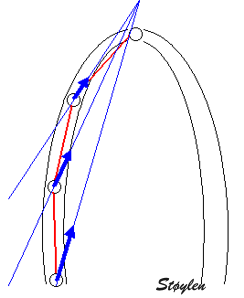
segmental borders, kernel positions and measurement lines are shown in red. Left: Segmental strain by tracking of kernels at segmental borders. It can be seen that the main deformation is measured along the longitudinal axis of each segment. As the wall thickens, the longitudinal mid line of the segments moves inwards, but in the basal and mid wall segments this does not add to the shortening as the angle does not change much. In the apex, however,  the angle of the center line changes,  contributing to the segmental shortening when it is measured by this method, however, the effect is slight.  To the right is shown the geometric assumptions of the 2D strain method.  The ROI uses an assumption of equal thickness from base to apex, and the mid line moves with the thickening of the contour.  The segment length is measured along the curved line, and both the curvature and the angle contributes to the shortening of the segment mid line as it moves inward. Thus, the shortening (strain)  might be expected to be higher in the apical segments by this method, as well as being dependent on the curvature, especially in the apex.  (However, this effect may be masked by the high degree of smoothing inherent in the application, which may distribute the differences between segments.  Ultrasound beams are shown in blue, illustrating the alignment problem of this method,  thus resulting in lower values in segments that are poorly aligned.

The main limitation of any echo method is the ones related to data quality.

AS discussed under each method;
  • The fundamental limitations related to all methods are the ones arising from:
  • Tissue Doppler, having the advantage of high frame rate has additional limitations related to:
  • Speckle tracking (in any form), being less angle dependent has additional limitations relating to:
    • Frame rate, with the risk of undersampling.
    • Tracking quality at high HR
    • With decreasing lateral resolution the method becomes more angle dependent, although to less degree than tissue Doppler.
  • Segmental strain, being robust and giving the opportunity of utilising both tissue Doppler and speckle tracking and eliminating the angle problem, has the additional problem of:
  • The 2D strain application, being robust and user friendly, has the additional problems of:
    • Smoothing, relying heavily on AV-plane motion,
      • which may give strain values even where there are none, and may reduce sensitivity for reduced regional function
      • Makes the tracking more difficult to assess visually
    • Curvature dependency, due to the technicalities of the specific applications, which may give too high values in the apex.
    • ROI width seems to be critical, especially in transmural strain.

Velocity gradient by automated segmentation

The combined segmental method described above, allows for velocity gradient imaging as well. Basically, the segment definition is automated. By choosing the velocity gradient method, the pre defined strain length is placed in the middle of the defined segment. Thus a velocity gradient representative for the segment can be obtained. It is the identical to the velocity gradient obtained by commercial software.

The strain length can then remain stationary as in most commercial versions, i.e. in the original position. The automated software, however, allow for using the automatic tracking features to make the strain length follow the myocardium. In most commercial software, this can only be done in a more cumbersome way by manual adjustment.

Comparison between methods in HUNT

In the HUNT study of normal values (153) we have compared the different methods for deformation measurement in a subset of 57 patients :
  1. The combined tissue Doppler - speckle tracking method described above
  2. Longitudinal velocity gradient from tissue Doppler without tracking of the ROI, this is similar to the longitudinal velocity gradient by commercial software, although in this application obtained by the experimental software.
  3. Longitudinal velocity gradient with tracking of the ROI, which can be done, althoufgh only approximate, by manual adjustment in commercial software, and
  4. Speckle tracking with the 2D strain application.

The velocity gradient is analysed by customised software, but the basic principle is exactly the same as in commercial software (EchoPAC), except allowing for automated analysis and automated tracking. The results were as follows:


Method 1: segment length by TDI and ST
Method 2: Velocity gradient (stationary ROI)
Method 3: Dynamic velocity gradient (tracked ROI)
Method 4: 2D strain (AFI)

Peak Strain rate
End systolic Strain
Peak Strain rate End systolic Strain Peak Strain rate End systolic Strain Peak Strain rate End systolic Strain
Apical -1.12 (0.27)
-18.0 (3.6)
-1.46 (0.85)
-14.6 (9.0)
-1.31 (0.73)
-17.2 (9.1)
-1.12 (0.37)
-18.7 (6.6)
Midwall
-1.08 (0.22)
-17.2 (3.2)
-1.29 (0.56)
-18.2 (7.4)
-1.40 (0.58)
-16.9 (7.1)
-0.99 (0.23)
-18.3 (4.7)
Basal
-1.03 (0.24)
-17.2 (3.5)
-1.71 (0.94)
-19.6 (9.3)
-1.59 (0.74)
-17.1 (8.6)
-1.12 (0.36)
-18.0 (6.2)
Mean
-1.08 (0.25
-17.4 (3.4)
-1.45 (0.79)
-17.7 (8.5)
-1.43 (0.67)
-16.7 (8.1)
-1.07 (0.33)
-18.4 (5.9)
Comparison between methods. Standard deviations in parentheses. Thanks to Eirik Nestaas, MD, PhD for discovering a typographical error in this table, that now has been corrected (bold types).

Looking at the findings, it is evident that the tissue Doppler methods gives close to 30% higher peak strain rate values that the two other methods. This is probably due to a higher random noise component in tissue Doppler, rather than the opposite, too low peak values due to under sampling in the two other methods. This is evident from two reasons:

  1. Tissue Doppler derived strain rate shows a far wider standard deviations
  2. Integrated strain from strain rate eliminates the differences, showing that the noise is random.

Thus the tissue Doppler is more sensitive to noise than other methods. However, systolic strain values were very similar with all methods (except in the apex for TDI with fixed ROI), showing that the smoothing that is a function of temporal integration eliminates this problem, and basically in strain measurements tissue Doppler is as reliable as other methods, although still with somewhat higher standard deviations.

Another thing is also evident: Tracking the ROI in tissue Doppler results in equal strain values in apex, midwall and base, as in the other two applications, while no tracking yields lower values in the apex. This is due to the variable angle in the apical segments, as the segment becomes shorter, they also become more crosswise.  so there is an advantage by tracking, but only in the apical segments. There was no difference in strain rate, only in strain, but as peak strain rate is early in the systole, while peak strain is (near) end systolic the effects of tracking may be greater. The reason is probably poorer alignment in end systole if the ROI is not tracked.

In a study of the sensitivity of strain rate imaging in stress echo (128), no significant difference was found between the segment length and the dynamic velocity gradient, despite the higher noise component in velocity gradient, nor between peak systolic strain rate versus end systolic strain.

Finally it seems that the combined method and 2D strain gives almost the same results, , although there was some statistical differences, these were small and of little clinical importance. Standard deviations, as a measure of variability were also comparable, in the combined method probably due to low noise because of low spatial resolution, in the 2DS probably due to smoothing. But it seems that the normal values are transferable, and for strain between  methods. In a reproducibility study (154) the two methods also had similar inter observer reproducibility (different recordings and analysers).

Other authors have found a base to apex gradient (highest strain in the apex) in strain values with the 2D application (155), but this may be due to the curvature effect in the apex, although MR studies report the same finding. Strain measurement, however, is still dependent on the analysing method,  and even the definition  may vary, depending on how the strain length is defined.


3D speckle tracking. 

Hypothetically, 3D speckle tracking may have some advantages over 2D:

  • There is no out of plane motion of speckles, thus eliminating one source of drift
  • This may also mean that 3D speckle tracking needs a lower frame rate to track, tracking quality is dependent on smallest possible changes from frame to frame, but this again is partly a function on the disappearance of speckles out of plane. However frame rate should still be so high as to avoid undersampling.
  • A full volume acquisition hypothetically allows tracking in all strain directions in the same heartbeat, without having to acquire multiple views.
However, the limitations of 3D ultrasound are still very severe:

  • Low frame rate. Even if the frame rate may be lower in 3D, as speckles don't disappear out of plane, the low framerate at least limits the number of different measurements, probably to endsystolic strain only.
  • As speckle formation is a partial random process (some speckles are real scatterers, some are interference patterns, the speckle pattern will not repeat perfectly from beat to beat, and thus speckles will still disappear across stitching borders, in a stitched 3D image. Stitching thus still allows speckles to disappear across stitching boundaries.
  • Low line density. This results in speckles being "smeared out", much in the same way as in 2D with high frame rate. Thus, even if speckles don't disappear, they may not move either. And if the line density is increased by MLA, this will result in MLA artefacts that has to be compensated by smoothing as well, with relatively little gain in lateral resolution.
  • Diverging lines from apex to base. This is the same in both 2D and 3D, but the effects becomes much more severe when line density is low at the outset. Even in 2D speckle tracking, transmural tracking from apical images become unfeasible in the base of the left ventricle as shown here.


In practice, the temporal and resolution is so low, as to make 3D speckle tracking inferior. And as 2D image with modern computational techniques improve in both resolution AND frame rate, 2D speckle tracking seems to increase it's edge.

In a recent study (279) of myocardial infarcts, 3D strain did not show incremental diagnostic value to the other modalities. 3D longitudinal strain was inferior to 2D longitudinal strain, and 3D Circumferential, longitudinal and area strain did not add information, as opposed to infarct area by tissue Doppler (243).

Tracking in RF data:

AS the reflected ultrasound signal really consists of not only information about the amplitude and wavelength, but about the actual waveform being reflected, this information can be extracted. From these data, both grey scale information and Doppler data can be calculated. (In fact this is what is done by the scanner, before giving what is known as "raw data".) Extracting the RF data themselves requires far more storage, and thus computational power in post processing, and has so far been slow. However, the RF data can also be used for tracking, in a matter similar to speckle tracking. Both cross correlation, normalised cross correlation, sum of absolute differences and sum of squared differences has been shown feasible (129). The method has been validated in both phantom (130) and animal experiments (131). This method has the advantage of being angle independent, as well as having the raw material for both tissue Doppler and grey scale image formation. Theoretical considerations indicates that this is advantageous in dealing with reverberation artifacts as well, compared to clutter filtering, but this remains to be shown. The clinical feasibility is so far not clear, as the method is time consuming and demanding in computational power.


Back to main website index.

References:


Editor: Asbjørn Støylen Contact address: asbjorn.stoylen@ntnu.no