Spectral display
As part of plugin development, it is sometimes essential to visualize the spectral modifications done to a sound. Of course, there exists many off-the-shelf options for spectral visualisaton, so why build one myself? I realize I need to be able to display both input, output, and more essentially the difference between input and output (seeing what my process have done to the sound), and also sometimes intermediate analyses internal to the effect being implemented. To enable this, I need to have a spectral display that can be inserted at any stage in the effect processing.
One of the challenges of making a spectral display is the horizontal scaling and shaping of the frequency bands. A regular FFT analysis will have a linear spacing of frequencies, while our sonic preception is logarithmic. A straight logarithmic spacing has some practical problems when used as a tool for visual display. The lower resolution in the high frequencies is all good, but a lot of space is used for the lowest frequency range. A lot of significant musical activity happens in the mid range, and with a logarithmic display, these frequencies gets a relatively small portion of the display area. To get around this, I remapped the spectral analysis into semitones (or adjustable factors of semitones) to be used for display, and also added an optional “skew” factor to give more space to low or high frequencies after the semitone remapping. The display uses standard SVG inside Cabbage.
The display will be used in the development of a series of spectral manipulation plugins (in progress, see later posts for updates). You can get the Csound code for the Cabbage plugin here at github.
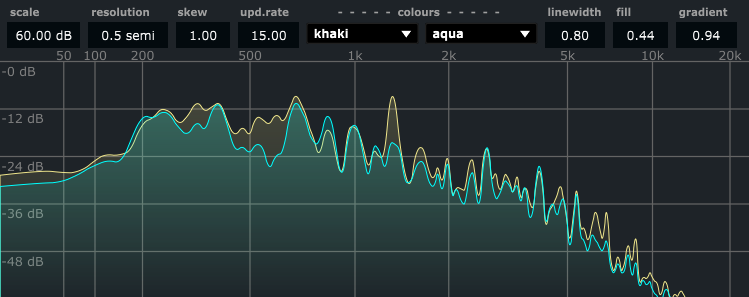
Spectral display screenshot, stereo input, constant Q resolution of 1/2 semitone
Tags: dsp