Shades of blue colours is traditionally used in nautical charts to display shallow water. The problem is that what is shallow for one size of ships might not be so for another size. To understand the extent of navigable water the bridge crew has to make a number of relatively complicated mental calculations adding the tidal situation, squat and heave to the ship's daught. Dynamic NoGo areas is an automatic way of displaying shallow areas that will give the bridge officer an at a glance knowledge of his ship’s manoeuvrable space, present, and along the future route. A prototype has been developed and was tested in the EU project ACCSEAS with professional mariners. The system was rated as good and acceptable from a professional point of view although there is still improvements to be made.
.
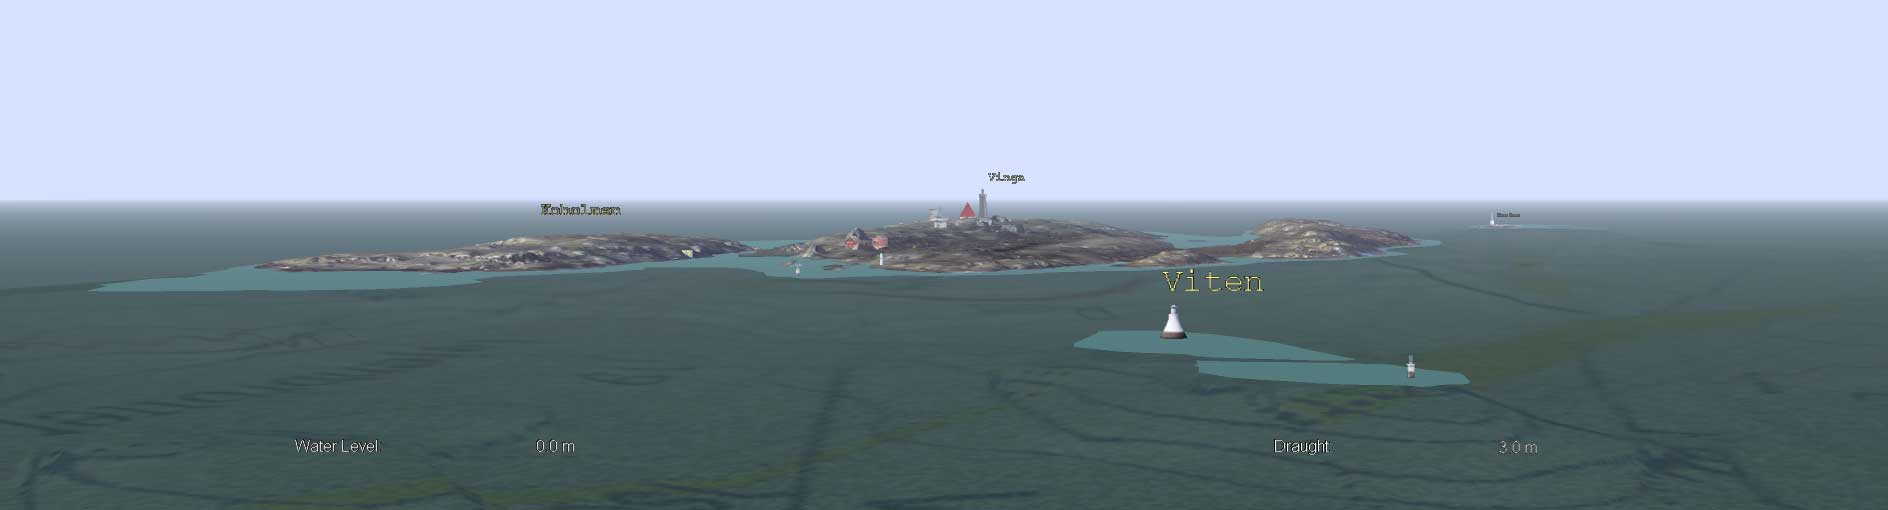
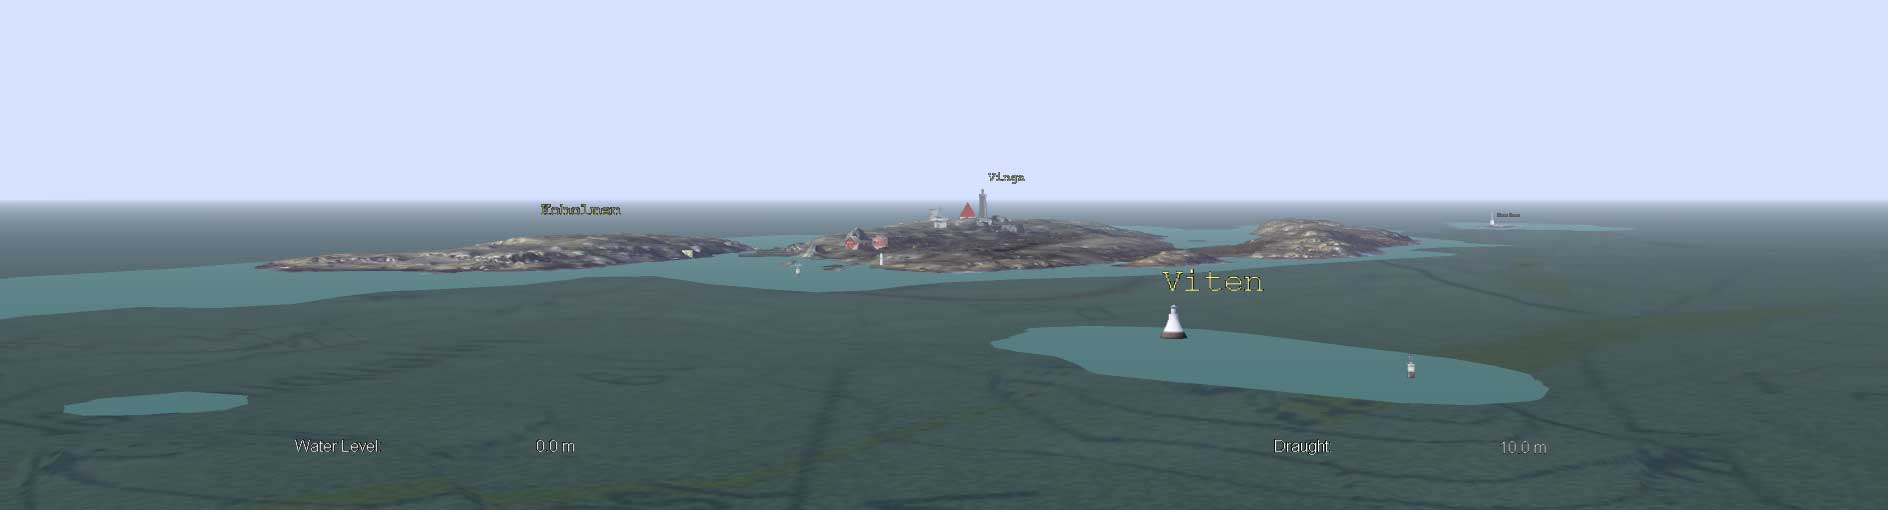
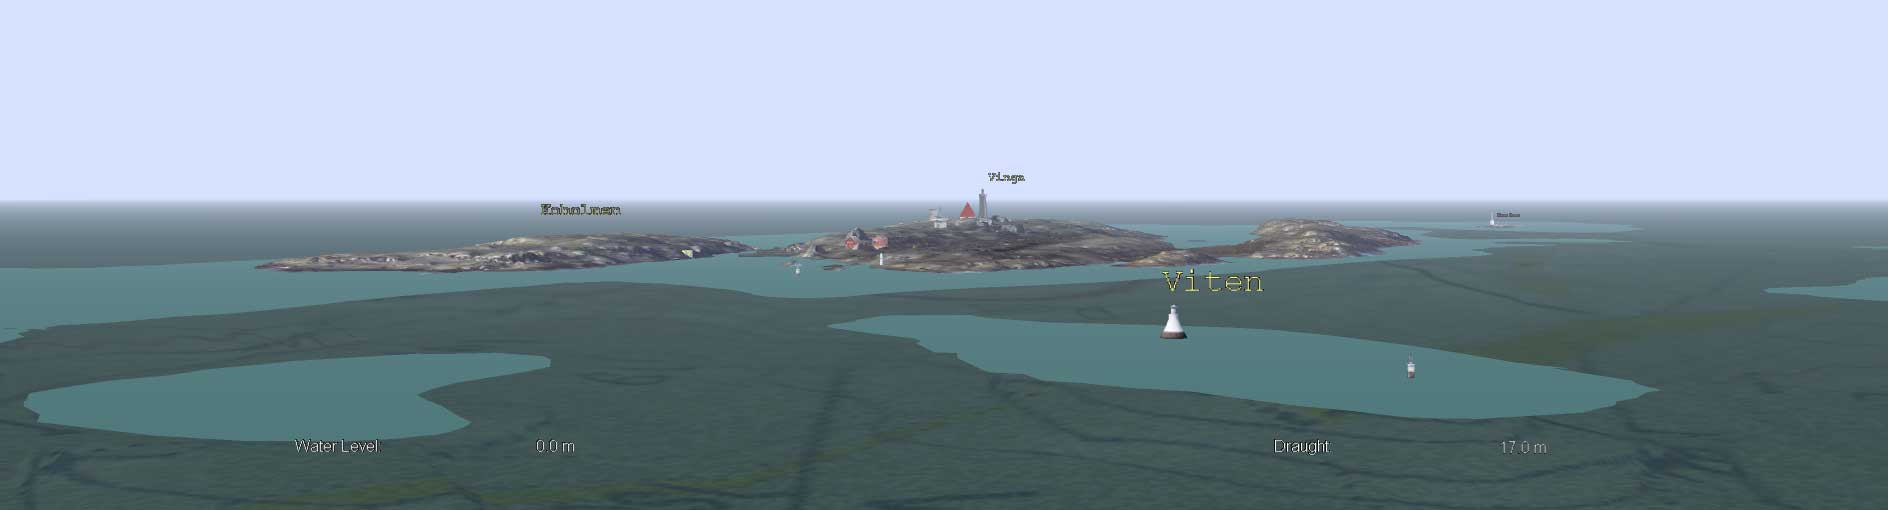
NoGo areas polygones for a max draught of 3, 10 and 17 meters implemented in a 3D chart over Vinga lighthouse in the entrance to Göteborg, Sweden. Screen dumps from a prototype application (Porathe, 2006).
.
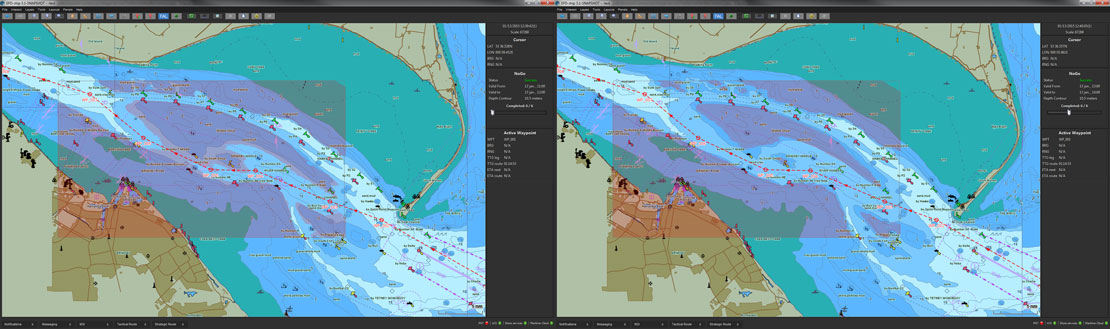
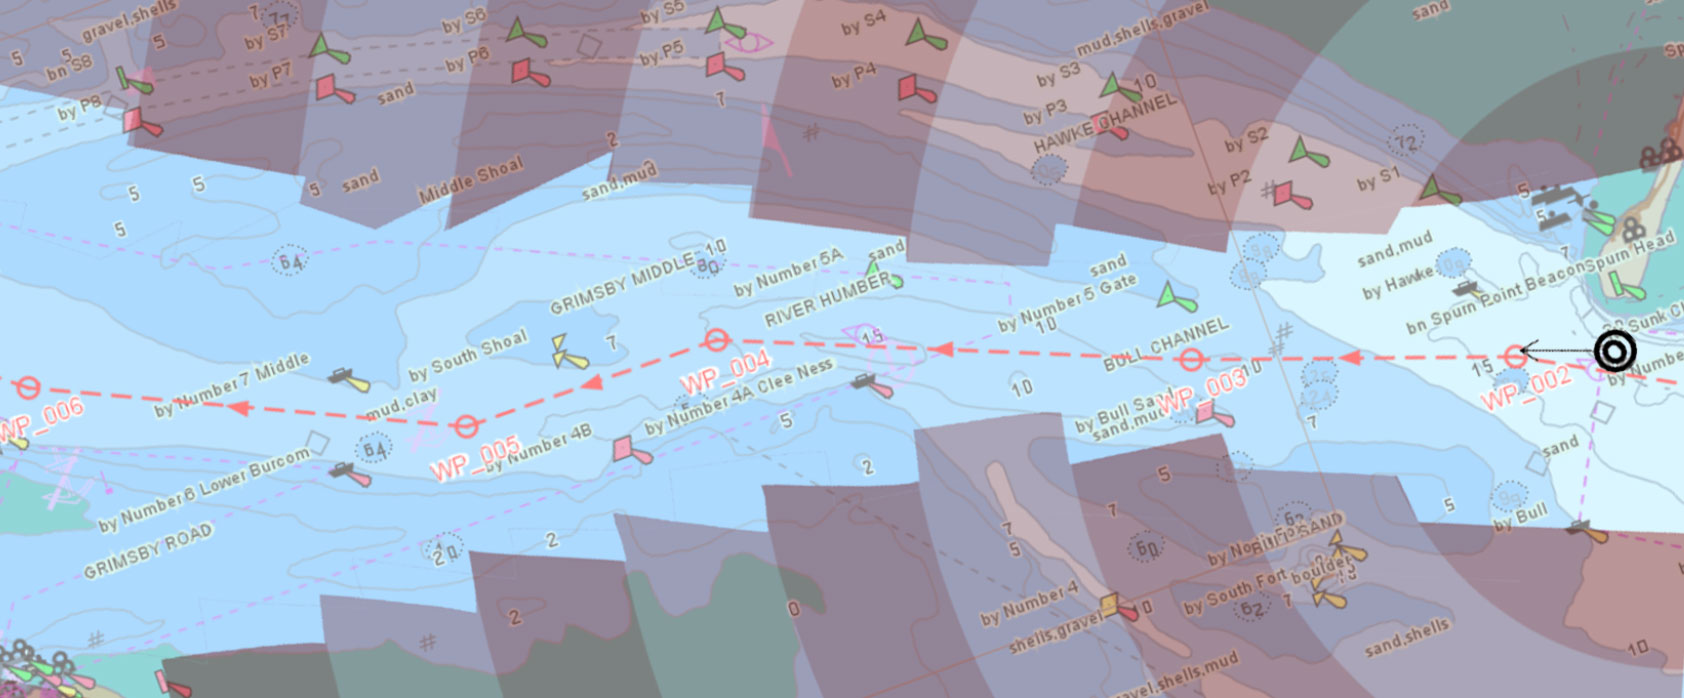
Test applications for the Humber Estuary in England. This application was tested with bridge officers, pilots and VTS operators at the full mission bridge simulators at Chalmers University of Technology in October 2014 with good results.
.
 A
A Future research. Time dependant NoGo areas might look something like this. It is generated automatically in front of the ship and does not only take ships draught into consideration, but also the tidal situation at a particular point along the ships future route at the time the ship will be there. The time segments could for instance be 30 minutes.
Publications
Porathe, Thomas; Bentzen Billesø, Mads. (2015) Human Factors in e-Navigation: a study of Dynamic NoGo Area Visualization in Electronic Nautical Charts. In Proceedings of International Conference on Advanced Intelligent Maritime Safety and Technology, Daejeun, South Korea m12-14 November 2015.
Porathe, T. (2006). 3-D Nautical Charts and Safe Navigation (doctorial dissertation). Malardalen Univarsity Press, Västerås, Sweden
Footer
Copyright © 2015 · All Rights Reserved · My Website