Grid plot in Julia
Posted on November 15, 2022 • 1 minutes • 181 words
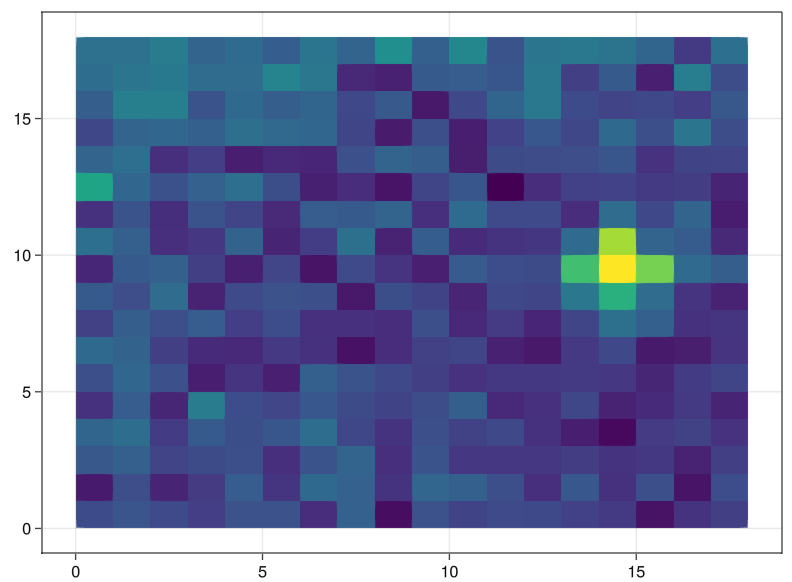
After deciding that I should get more used to program in Julia, this is one of my first attempts: A grid plot a.k.a. an old time favorite in spatial stats. All the steps to end up with the expected results are:
- Installing Julia (I alredy had done that)
- Finding an IDE: Visual Studio.
- Inspecting commands like: typeof()
- Installing some packages.
- Finding out which package to use to open a matlab file (data here).
- Learning some characteristics of Julia, for example, how it completes matrices. I needed this in order to present a vector in “the right form”.
- Using the required function to plot the grid.
My code is here:
vars = matread("/Desktop/R0_time2.mat") # This is a dictionary
m = vars["R0_time2"]; # This is a matrix
vals = m[1, :]; # The feature I want to plot is in one row
vals2 = reshape(vals,18,18)'
d = [];
for i in 1:18
    j = 19-i
    d = vcat(d,vals2[j,:])
end
e = Vector{Float64}(d) # I had to assing this type in order to plot with viz.
grid = CartesianGrid(18, 18)
viz(grid, color=e)
The plot: