Data frames and plot recipes in Julia
Posted on December 20, 2022 • 1 minutes • 156 words
Inspecting tabular data in R is so easy and convenient that R is still my favorite in this regard. What about Julia? Today I decided to see if there something like dplyr but I couldn’t find it. Anyway, fortunately it was fast to do basic things like filtering and counting rows with specific conditions:
using DataFrames
using CSV
using Plots
using StatsPlots

df = download_titanic()
names(df)
combine(groupby(df, [:pclass, :sex]), nrow => :count)
filter(row -> row.sex == "male" && row.pclass == 1, df)
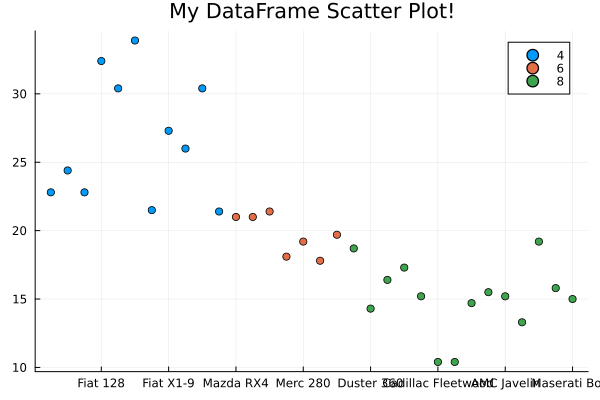
I wanted to see how making a plot using data frames would be too. I saved a dataset from R and later learned there is a library that contains R datasets! Anyway I am happy to announce that the recipes in Julia are so easy to use that this is one my favorite Julia features so far!
df_cars = DataFrame(CSV.File("~/Desktop/mtcars.csv"))

plot_ = @df df_cars scatter(:Column1, :mpg, group = :cyl, title="My DataFrame Scatter Plot!")
savefig(plot_,"~/Desktop/plot_recipe.png")