|
. :
3D modelling of free forming meanderin evolution without any initial pertubation |
Water and sediment flow in an alluvial channel was modeled using a CFD program. The simulation was started from an initially straight grid, without any perturbation at the inflow boundary. The model computed the river bed evolution leading to a meandering river system. The results were compared to observations from a physical model study. The results of the simulation showed that the predicted meander evolution was in fairly good agreement with the measured values. The model reproduced the flow pattern in meandering river systems in detail, showing the secondary currents and their impact on the interaction between sedimentation and erosion of the banks.
To model a self forming, meandering channel, the CFD program was initalised with the same input data as used in the physical model study carried out by Zimpfer (1975). The Figure below shows the river bed evolution after 22500 seconds. Small pools and places of deposition on the left and right side of the channel are alternating (Figure a). Figure b illustrates the vertical velocities at the same place and time as shown in Figure a. Cells of secondary currents can be seen, alternating with the same wavelength as the bed movements.
|
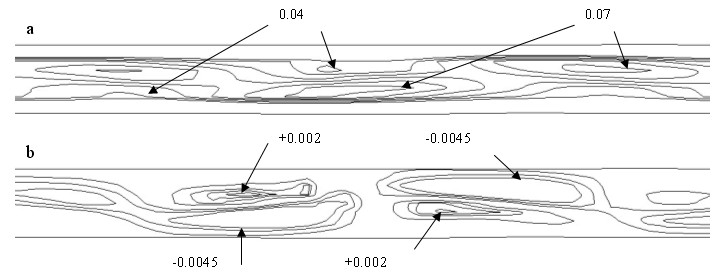
Plan view of water depth contour plot (a), values in meters. The contour plot of vertical velocities (b), values in m/s. 22500 seconds after initialising the simulation
|
|
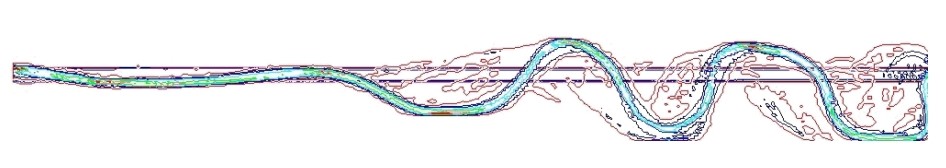
Plan view of water depth contour at 27500 seconds; click picture to start animation of the water depth evolution from 13000 to 27500 seconds (200000 seconds over all).
|
In Figure below, the plan view of the fully evaluated flow pattern over time is illustrated. It can be seen that after 50000 seconds the flow has started to erode the river banks homogeneously over the whole channel length. The meandering structure began to develop at the downstream end of the flume at around 75000 seconds and moved upstream with ongoing time. The analysis also showed, that the meander pattern tended to develop much slower compared to simulations where the inflow conditions contains flow influencing elements, like initial bends or a skewed inflow (Olsen 2002). In addition to this, the simulation showed that the meander pattern could not develop over the whole channel length. Fully developed meander bends seem to emerge only in the downstream part of the flume.
|
click to see the whole meander evolution over time [ slow]
[ fast] (animated gif)
click [ here]to see the whole meander evolution over time in avi format (2.5MB)
|
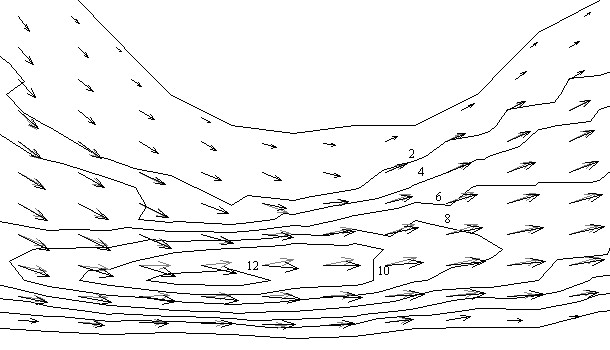
The next Figure shows an enlargement of the most downstream bend after 185000 seconds, plotting the velocity vectors upon the contour map of the bed levels. The maximum water depth is located at the outside of the bend. Consequently the lateral slope at this position is fairly steep. Whereas on the other side of the cross-section, the slip-off slope, one can observe relatively shallow water depth. These observations match the results out of the physical model study (Zimpfer 1975). Looking at the vectors the velocities at the water surface (black lines) are higher than that close to the river bed (dotted/grey lines). This fact corresponds to the friction due to the roughness of the bed. Furthermore, the velocities in bend at the riverbed are following the direction of the thalweg and the those at the surface are tended more towards the outside of the bend. This is the result of the secondary current occurring in a meander bend and proves that the CFD model is able to simulate that secondary current.
|
|
Plan view of the velocty vectors (black at surface, grey at the buttom) and the contour plot of the water depth in
a meander bend at the downstream end of the simulated flume.(Values in cm)
|
Another phenomenon is observed which will be the topic of further investigations. Two times over the simulation, the flow in the thalweg is exposed to a sudden sediment deposition located in the most downstream part of the flume. This deposition seems to be large enough to act like a small dam in the main channel. This leads to a cut off of the downstream channel part and hence, to a reduction of the flow velocity in the affected area. Due to the sedimentation the water level is rising and starts to spread out over the floodplain in order to find a new thalweg. In this stage the flow is similar to the flow in an estuary, characterised by shallow water levels and low velocities. From this point the flow is trying to form a new thalweg and after 2500 seconds a new meandering flow pattern is developed.
|
Sudden sedimentation of a bend in the most downstream part of the flume after 148000 seconds. 1500 seconds between each picture
|
A CFD model has been used to simulate a self forming meander pattern over time. From an initially straight alluvial channel, the model computes the lateral motion of the meander bends as well as their movement in longitudinal direction. Hence, the program predicts the process of erosion and sedimentation in good agreement with results of the physical model study. This process is a result of a special hydraulic regime in a meandering river system. It is strongly dominated by secondary currents, occurring in the channel bends. These currents are also reproduced by the model. Despite of the good results, there have been some irregularities concerning the sediment movement in the most downstream part of the simulated channel, which will be the topic of further investigations.
|
|
: .
3D modelling of free forming meanderin evolution without any initial pertubation |
|
|
© by NR
Last Update 29.09.2004
| | | | | |